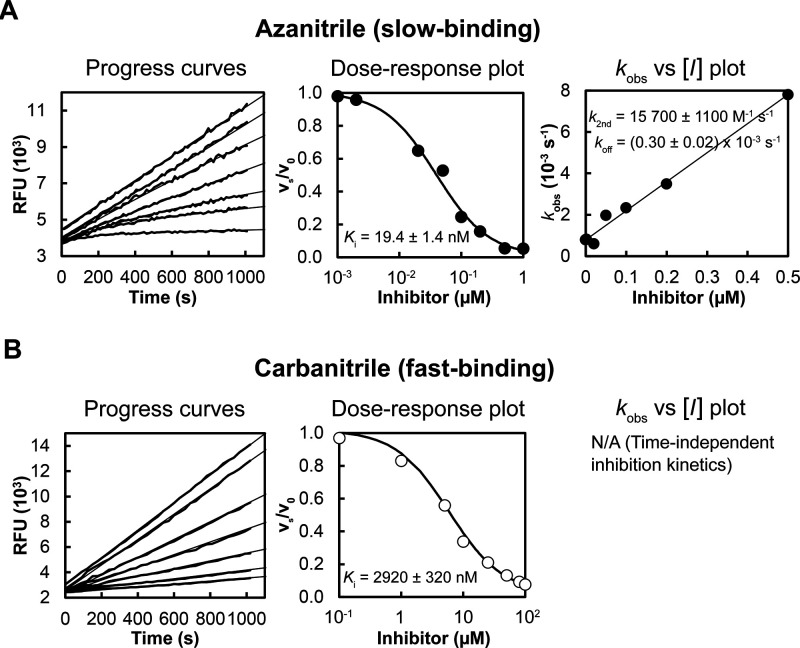
Figure 2.
Different binding kinetics of SmCB1 inhibitors with azanitrile and carbanitrile warheads represented by 2a and 2c, respectively. Progress curves show the hydrolysis of the fluorogenic substrate Cbz-Phe-Arg-AMC by SmCB1 in the presence of increasing inhibitor concentrations. (A) The azanitrile exhibited a time-dependent inhibition characterized by nonlinear progress curves typical of slow-binding kinetics. (B) Linear progress curves obtained for the carbanitrile are characteristic of fast-binding inhibitors. In dose–response plots, the derived steady-state reaction velocities were plotted against inhibitor concentration, and the inhibition constants Ki were obtained. In the kobs versus [I] plot, the first-order rate constants kobs from the time-dependent progress curves were plotted against inhibitor concentrations to show a linear dependence. For details on data fitting and kinetic parameters, see the Methods.

