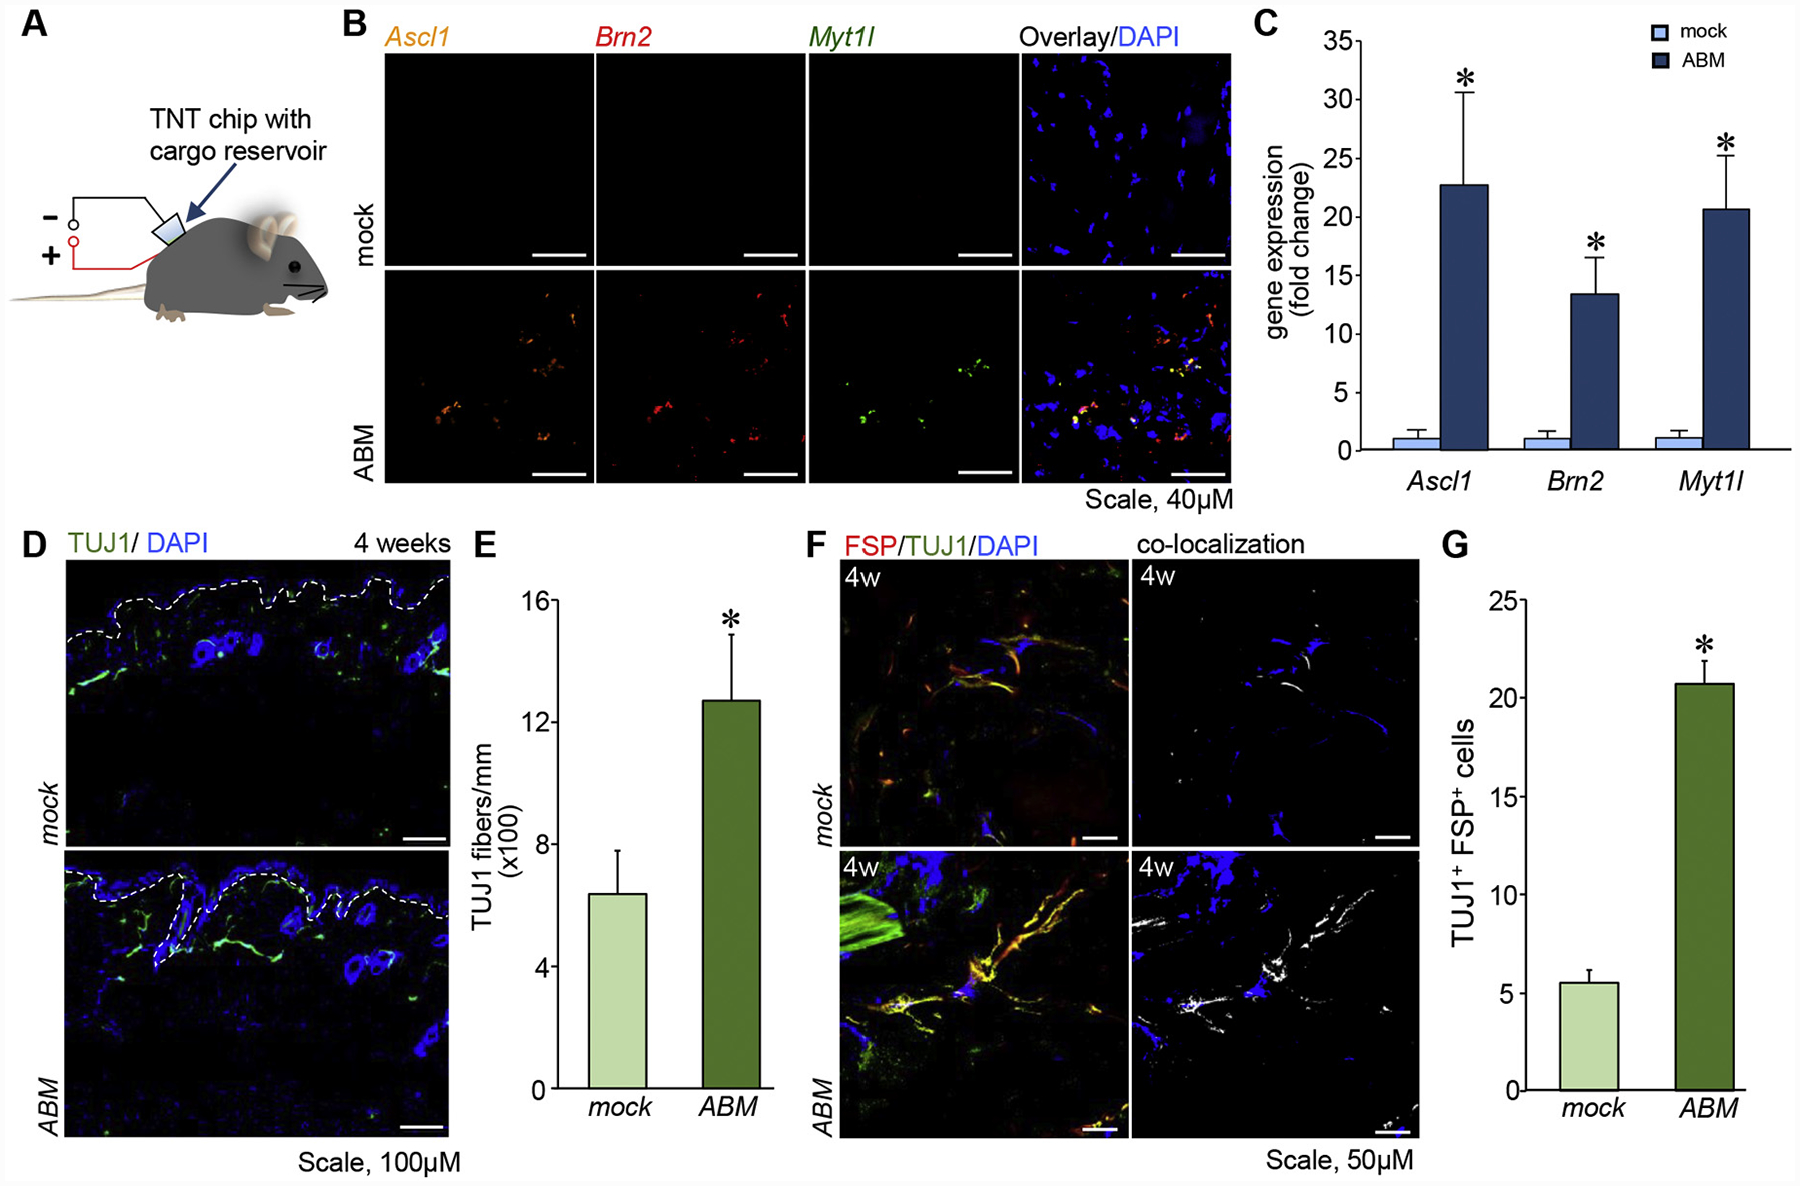
Figure 2. TNTABM into the dorsal skin of C57Bl/6 mice resulted in stromal reprogramming.

(A) Schematic diagram of TNT. (B) Confocal microscopic images showing three-plex in situ hybridization of Ascl1, Brn2, Myt1l, counterstained with DAPI. (C) RT–qPCR analysis of ABM gene expression in skin 24 h post-TNT. (n = 4), (D) Immunostaining showed TuJ1 fibers in skin. White dashed lines indicate epidermal and dermal junction. (E) Quantification of TuJ1+ fiber length per mm epidermis length. (n = 6) (F) Confocal microscopic images of skin showing co-localization (white) of FSP and TuJ1. (G) Quantification of TuJ1 and FSP positive cells per field of view. Data expressed as mean ± SEM (n = 3–4), *P < 0.05.
