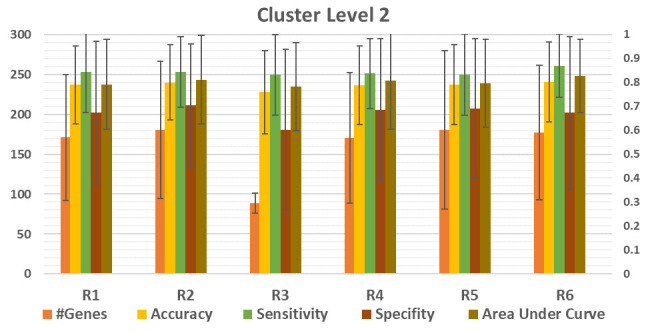
Figure 4. Comparison between the performance of six (R1,..,R6) different functions, listed in Table 3.

The average of 100 iterations if computed for different performance measurements for each R1,…,R6 over the 12 datasets. The results of the level of cluster 2 is presented. #Genes is the average number of genes in level 2. The average accuracy, sensitivity, specificity and area under the curve (AUC) is presented for R1,..R6.
