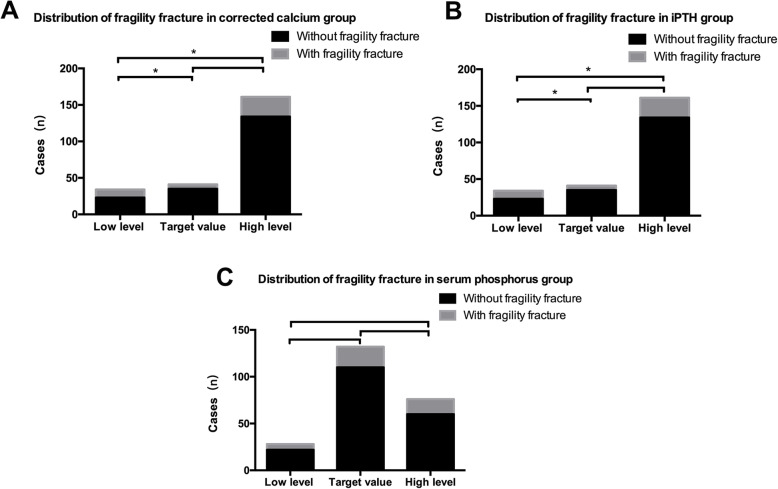
Fig. 3.
The distribution of fragility fracture cases in three subgroups of serum corrected calcium, phosphorus and iPTH. a. Distribution of fragility fracture in low level,target value and high level corrected calcium subgroup. *: p< 0.05 when the designated two subgroups were compared. b. Distribution of fragility fracture in low level,target value and high level iPTH subgroup. *: p< 0.05 when the designated two subgroups were compared. c. Distribution of fragility fracture in low level,target value and high level serum phosphorus subgroup. *: p< 0.05 when the designated two subgroups were compared

