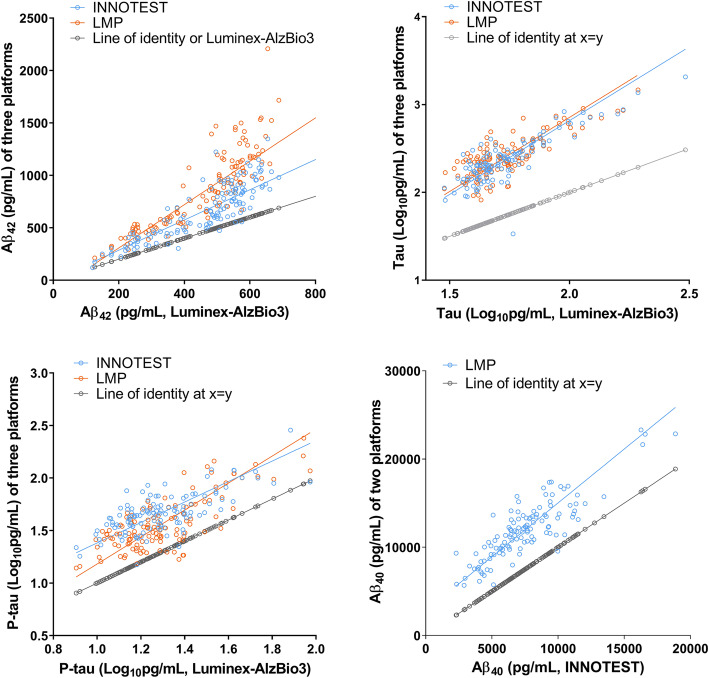
Fig. 2.
Correlations among CSF biomarker levels determined by three immunoassay platforms. The Spearman correlation coefficients between Aβ42, t-tau, and p-tau levels measured by Luminex and INNOTEST were 0.87, 0.76, and 0.71, respectively, and the coefficients between the Luminex and Lumipulse G were 0.90, 0.71, and 0.76, respectively. Aβ42, t-tau, p-tau, and Aβ40 levels measured by INNOTEST and Lumipulse G showed strong correlation coefficients, i.e., 0.91, 0.83, 0.91, and 0.86, respectively. Solid lines indicate the fitted lines of the Passing-Bablok regression. The Passing-Bablok regression analysis for method comparison showed that Aβ42 levels by Luminex were not valid in cusum test for linearity. For tau proteins among 3 assays or Aβ42 levels between INNOTEST and Lumipulse, the analysis showed the comparability between immunoassay methods. Gray symbols and lines indicated the values of x = y

