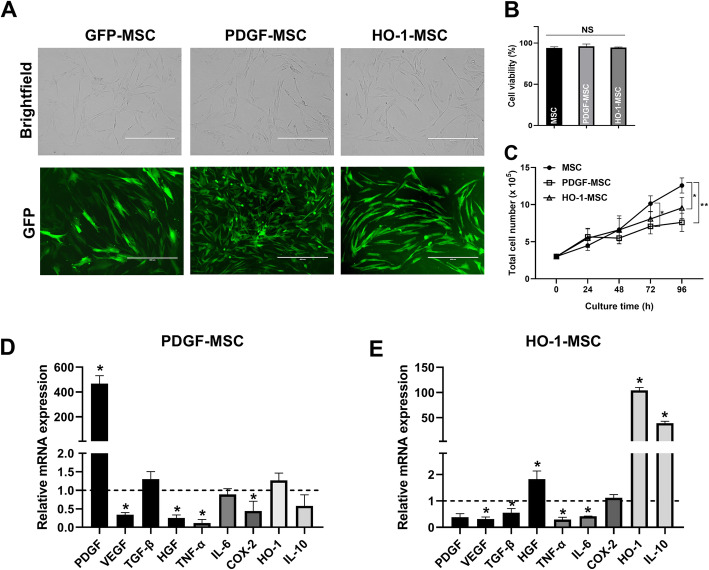
Fig. 2.
PDGF or HO-1 lentiviral transduction efficiency in canine AD-MSCs. a Brightfield and GFP images of canine AD-MSCs transduced with PDGF or HO1; GFP expression indicates the successful transduction of PDGF or HO1 (scale bar = 400 μm). b Cell viability assay at passage 3. c Time course of cell proliferation. d, e Relative mRNA expression of various genes in PDGF-MSCs and HO-1-MSCs. Data are expressed as fold change of gene expression compared to GFP-MSCs (dashed line). *P < 0.05 and **P < 0.01 compared with the GFP-MSC group. NS, not significant

