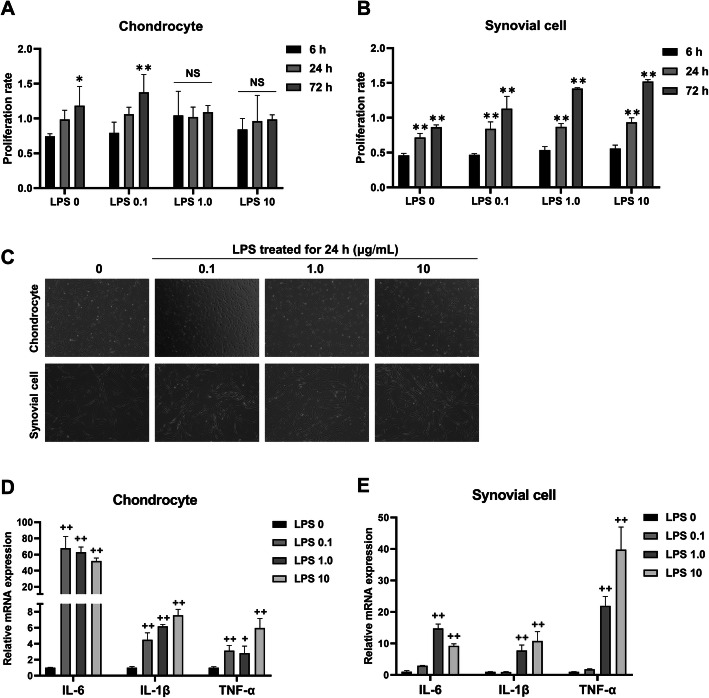
Fig. 4.
LPS-induced inflammation model of canine chondrocytes or synovial cells. a, b Cell proliferation rate of chondrocytes or synovial cells when exposed to a variable dose of LPS for 6, 24, and 72 h measured by MTS assay. *P < 0.05 and **P < 0.01 compared to the 6 h group at specific LPS concentrations. NS, not significant. c Representative phase-contrast images of chondrocytes or synovial cells incubated with LPS for 24 h (× 100 magnification). d, e mRNA expression of inflammation-related genes after exposure with 0 (control), 0.1, 1, and 10 μg/mL LPS for 24 h. +P < 0.05 and ++P < 0.01 compared to the control group

