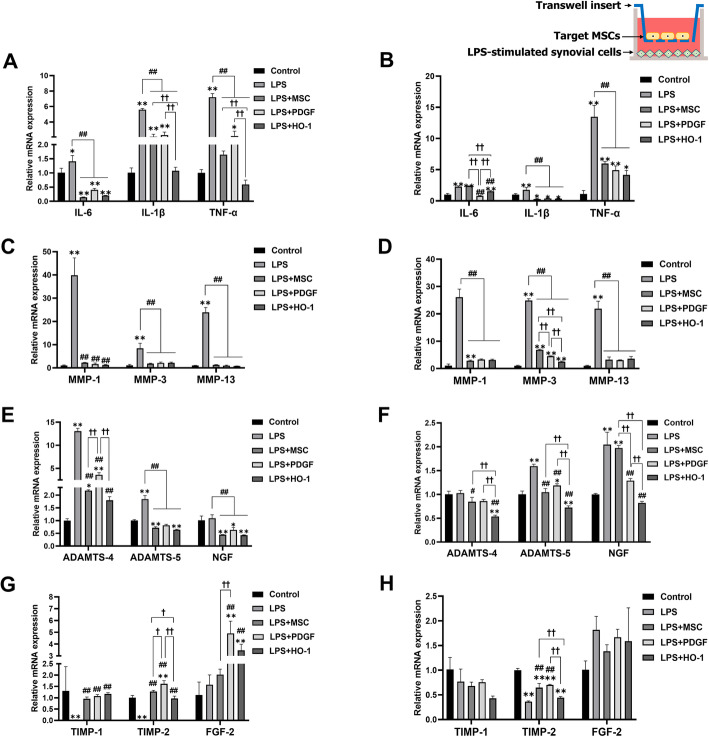
Fig. 6.
Gene expression of LPS-stimulated synovial cells when co-cultured with MSCs, PDGF-MSCs, or HO-1-MSCs. a, b Pro-inflammatory factor expression after 24 and 72 h of incubation. c, d Collagen degradation markers. e, f Expression of aggrecan degradation markers (ADAMTS-4 and ADAMTS-5) and pain-related marker (NGF). g, h Expression of anti-degradation factors. Data are shown as fold change compared to chondrocytes alone. *P < 0.05 and **P < 0.01 compared to the control. #P < 0.05 and ##P < 0.01 compared to the LPS group. †P < 0.05 and ††P < 0.01, a significant difference between the indicated groups

