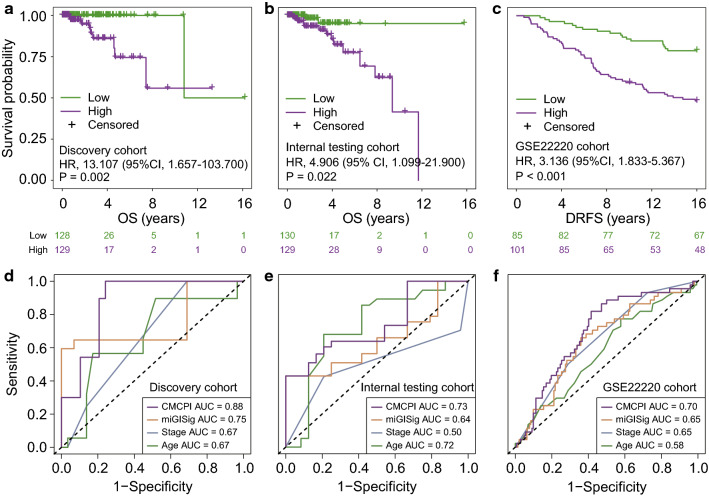
Fig. 3.
Establishment and performance comparison of CMCPI. Kaplan–Meier estimates of OS or DRFS of patients with low or high CMCPI scores in the discovery cohort (a), internal testing cohort (b) and GSE22220 cohort (c). HRs and 95% CIs for high vs. low miGISig score was estimated using the univariate Cox analysis. P values comparing risk groups were calculated with the log-rank test. The ROC analysis at five years of OS or DRFS for the CMCPI, miGISig, stage and age in the discovery cohort (d), internal testing cohort (e) and GSE22220 cohort (f). BC breast cancer, CIs confidence intervals, CMCPI composite miRNA-clinical prognostic indicator, DRFS Distant relapse-free survival, HRs Hazard ratios, OS overall survival

