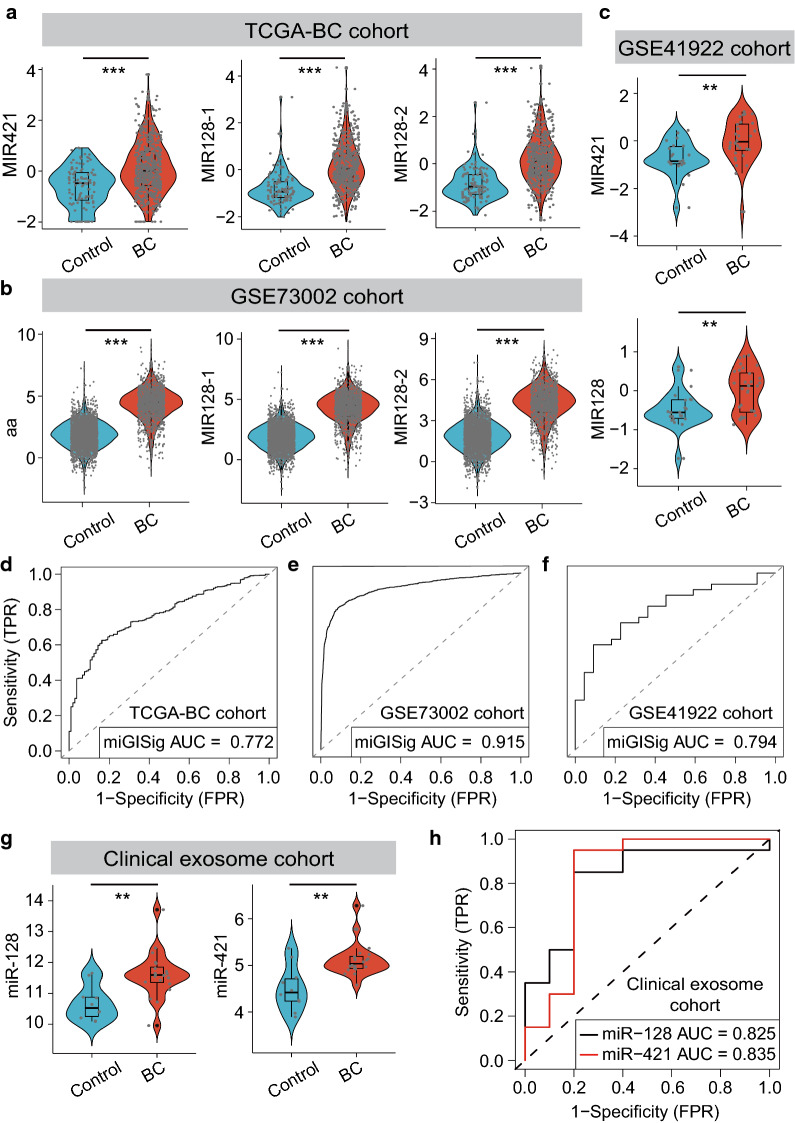
Fig. 4.
Value of miGISig for the diagnosis of BC. Violin diagram of the miGISig miRNAs expression level in healthy controls and BC patients in TCGA-BC cohort (a), GSE73002 cohort (b) and GSE41922 cohort (c). Statistical analysis was performed using the Mann–Whitney U test. ROC curve for the performance of the miGISig in the diagnosis in the TCGA-BC cohort (d), GSE73002 cohort (e) and GSE41922 cohort (f). g Violin diagram of the miGISig miRNAs expression level in healthy controls and BC patients in the in-house clinical exosome cohort. Statistical analysis was performed using the Mann–Whitney U test. h ROC curve for the performance of miR-128 and miR-421 in the clinical exosome cohort. AUC the area under the curve, BC breast cancer, ROC area under the receiver operating characteristic curve. *P-value < 0.05, **P-value < 0.01, ***P-value < 0.001

