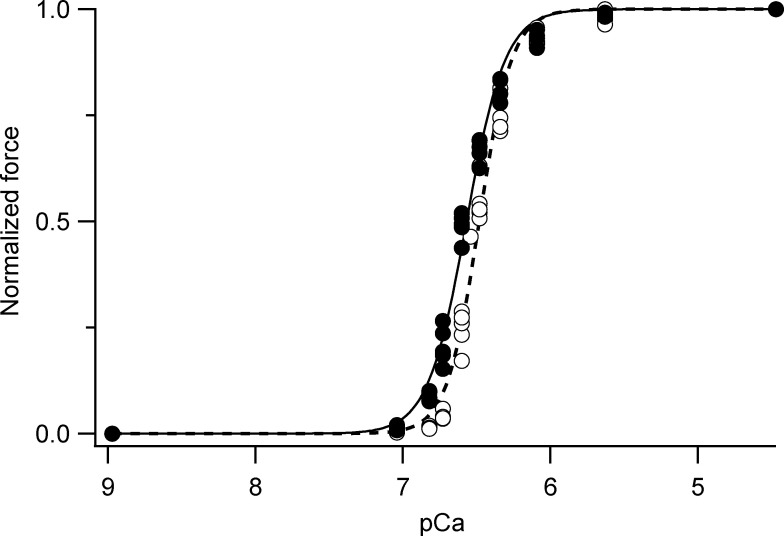
Figure S10.
Force-pCa titrations. Steady-state force at different pCa (= −log10[Ca2+]) normalized by the maximum force at pCa 4.7 in the presence (filled circles) and in the absence (open circles) of 5% Dextran. Data pooled from T-jump experiments from 1–12°C on single demembranated fibers from psoas muscle (n = 5 fibers). Thin continuous (dashed) line is Hill-curve fitted to the data in the presence (absence) of 5% Dextran with fitting parameters pCa50 = 6.48 ± 0.01 (6.57 ± 0.01) and n = 3.94 ± 0.21 (3.30 ± 0.14), mean ± std from the fitting.

