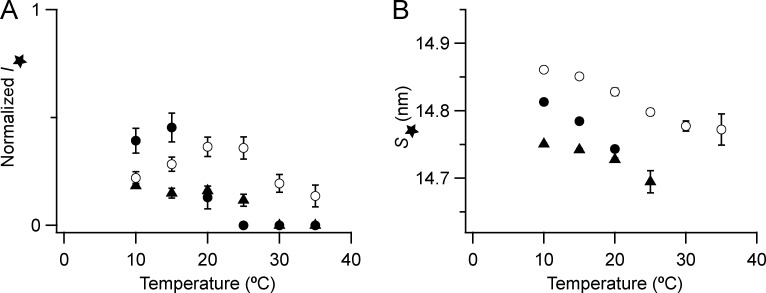
Figure S7.
Intensity and spacing of the star reflection close to the M3 reflection. (A and B) Intensity (A) and spacing (B) are shown. Mean ± SE. Open circles, no Dextran, n = 10 demembranated psoas fiber bundles; filled circles, 5% Dextran, n = 5; black triangles, resting intact mouse EDL muscles, n = 3. Intensities for demembranated fibers normalized by IM3 in the absence of Dextran at 30°C and those for intact muscles scaled to the value for demembranated fibers at 30°C in the presence of Dextran. The star reflection was not detectable in demembranated fibers at 25–35°C in the presence of Dextran and in intact EDL muscles at 30°C and 35°C; the corresponding intensities are plotted as zeroes in A.

