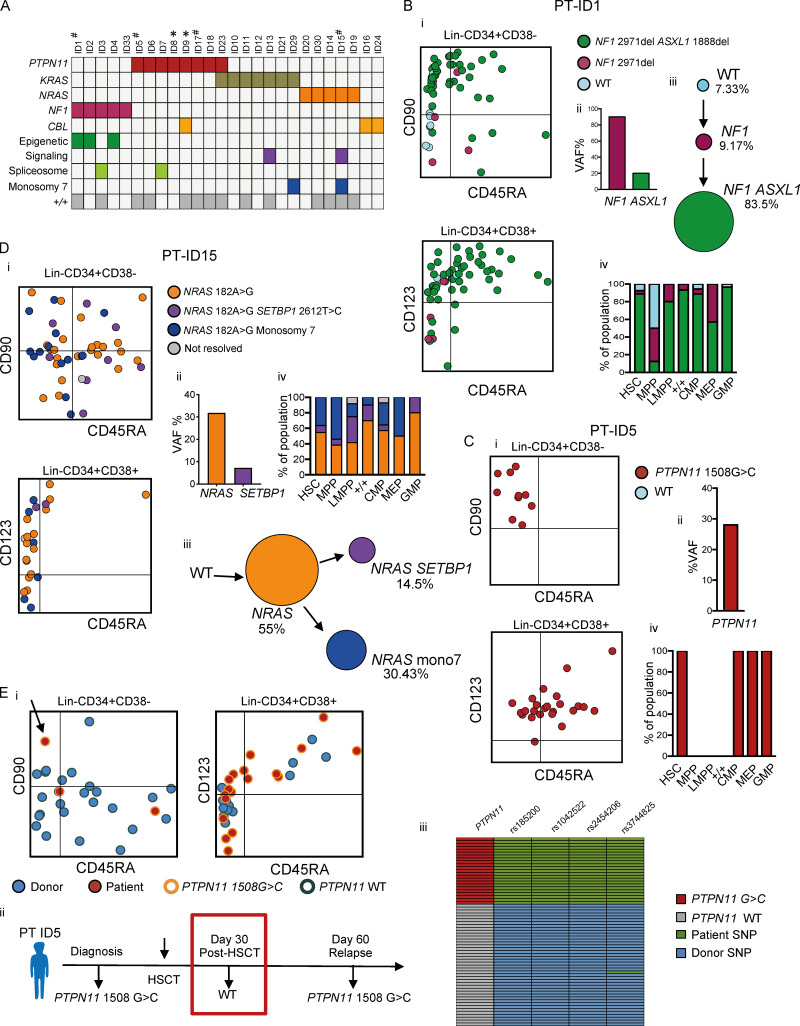
Figure 3.
Single-cell mutation tracing to phenotypic HSCs in JMML. (A) Mutations detected through a customized MDS/JMML targeted sequencing panel in whole JMML BM and/or PB samples (n = 26) at diagnosis except where indicated; each column represents an individual patient. All patients had RAS gene pathway mutations, in two cases involving two different RAS-pathway genes (ID9 and ID23). Secondary mutations were detected in 7/26 in epigenetic regulators (ASXL1, TET2), signaling (SETBP1), and spliceosome (SRSF2) genes; also two patients with monosomy 7 (see Table S1). Patients where the aberrant +/+ population was detected by FACS are shown in the bottom row; #, samples for single-cell genotyping; *, relapse or early posttreatment samples. (B–D) Single-cell mutational profiling for three JMML BM samples (ID1 [B], ID5 [C], and ID15 [D]). For each panel: (i) FACS indexing of CD34+ single cells with points colored by mutational status; top CD38−; bottom CD38+; (ii) variant allele frequency (VAF) at diagnosis for each mutation detected in bulk BM; (iii) inferred mutation hierarchy and proportion of each subclone (for ID1 and ID15 only); and (iv) proportion of each subclone in the indicated HSPC subpopulation. (Ei) FACS indexing of posttransplant (day +30) BM CD34+ cells from patient ID5 with single cells colored by donor/patient and mutational status; left: Lin−CD34+CD38−; right: Lin−CD34+CD38+. Arrow indicates a mutant HSC detected in the posttransplant sample. (Eii) Timeline of pre- and posttransplant PTPN11 mutation detection by targeted sequencing of bulk BM cells showing that the mutation was not detected by NGS at day +30. Marked day 30 sample used for single-cell genotyping. (Eiii) Heatmap of the 65 single cell–derived colonies analyzed showing PTPN11 mutational status and patient- and donor-derived SNPs. Details for number of cells sorted, processed, and analyzed are outlined in the relevant Materials and methods section.

