Figure S1.
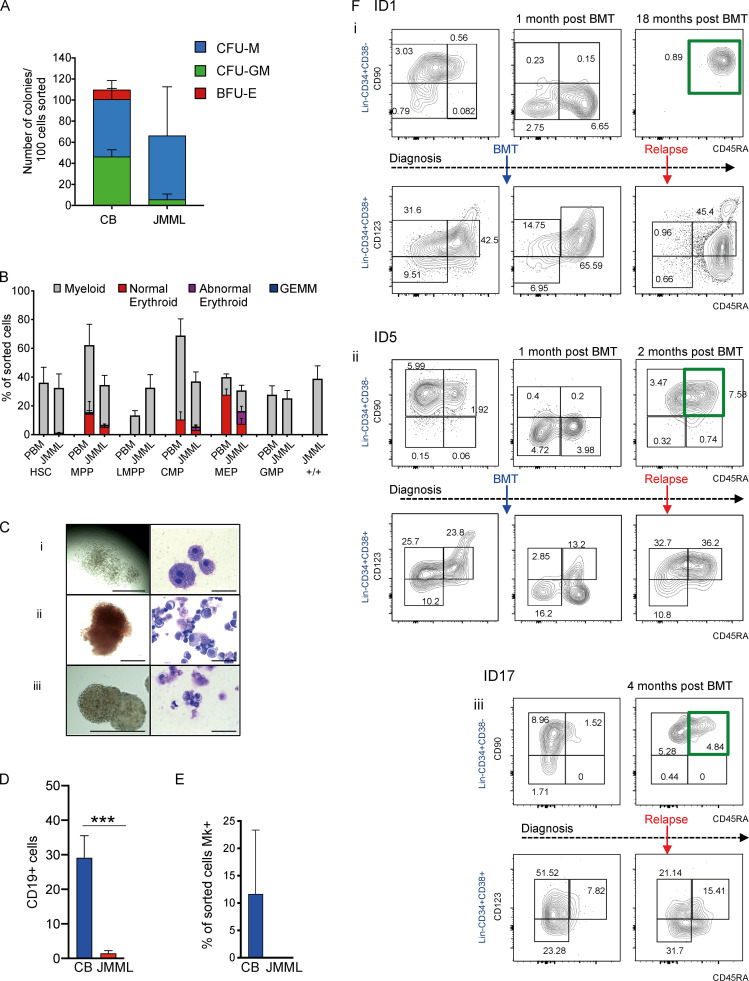
Single-cell phenotypic and functional analysis reveals heterogeneity of HSPCs in JMML (related to Fig. 1). (A) Bulk clonogenicity in methylcellulose, 100 cells sorted per assay (CB control, n = 2 different biological replicates; JMML, n = 2 different biological replicates); one experiment. CFU-M, CFU-macrophage; CFU-GM, CFU–granulocyte macrophage. (B) Clonogenic output of purified HSCs and progenitor populations from normal pediatric BM (PBM; n = 3 different biological replicates) and JMML (n = 7 different biological replicates) in single-cell methylcellulose assays. 11 independent experiments performed. (C) Representative examples of colonies (left column) and MGG-stained cells from individual plucked colonies (right column) from clonogenic assays in methylcellulose. (Ci) Macrophage colonies from the JMML Lin−CD34+CD38−CD90+CD45RA+ population; scale bars, 1,000 µm (left), 50 µm (right). (Cii) “Normal-appearing” erythroid colonies; scale bar, 200 µm (left), 50 µm (right). (Ciii) Abnormal erythroid colonies derived from JMML MEP; scale bar, 400 µm (left), 50 µm (right). (D) Lymphoid output of sorted HSCs (100 cells) from four different biological replicates from JMML BM samples (red bar) compared with four different biological replicates from normal controls (CB; blue bars). Cells cultured on MS-5 stromal lines, and output measured as percent CD19+ cells on gated hCD45+ cells (mean ± SEM) after 4 wk. Mann Whitney test, *** P = 0.0006. Data acquired over two independent experiments. (E) Percentage of wells with CD42+CD41+ megakaryocytes (Mk) in single-cell liquid cultures of normal CB (n = 2) and JMML (n = 2). Two independent experiments performed. (F) Representative FACS plots of serial patient samples from diagnosis, after BMT, and at clinical relapse: ID1 (Fi); ID5 (Fii); and ID17 (Fiii). Top panels for each patient represent Lin−CD34+CD38− compartment and bottom panel Lin−CD34+CD38+ compartments. Percentage of each population shown in the figure represents the percentage of Lin−CD34+. Green boxes indicate the aberrant Lin-CD34+CD38-CD90+CD45RA+ population. Data acquired over six independent experiments. BFU-E, burst-forming unit–erythroid; GEMM, granulocyte/erythroid/megakaryocyte/monocyte; LMPP, lymphoid primed multipotent progenitor.

