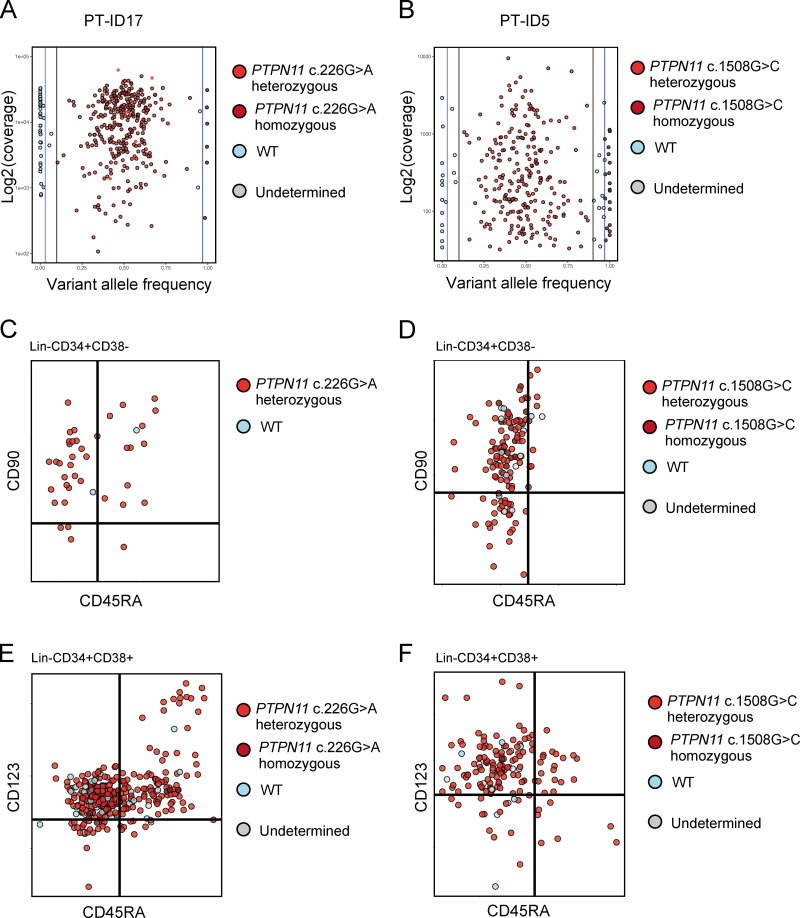
Figure S3.
Single-cell genotyping using TARGET-seq (related to Fig. 3). (A) Variant allele frequency (VAF) and coverage of PTPN11 c.226G>A amplicon sequenced from patient ID17 (total of 384 single cells sorted, 365 cells passed QC, coverage cutoff 100). (B) VAF and coverage of PTPN11 c.1508G>C amplicon sequenced from patient ID5 (total of 384 cells single sorted, 280 cells passed QC, coverage cutoff 30). (C) Single-cell mutation profiling: cells plotted as per FACS index data and colored according to their mutational status. Plots showing Lin−CD34+CD38− cells from patient ID17. (D) Single-cell mutation profiling: cells plotted as per FACS index data and colored according to their mutational status. Plots showing Lin−CD34+CD38− cells from patient ID5. (E) Single-cell mutation profiling: cells plotted as per FACS index data and colored according to their mutational status. Plots showing Lin−CD34+CD38+ cells from patient ID17. (F) Single-cell mutation profiling: cells plotted as per FACS index data and colored according to their mutational status. Plots showing Lin−CD34+CD38+ cells from patient ID5. Data acquired with two independent experiments (one per biological replicate).

