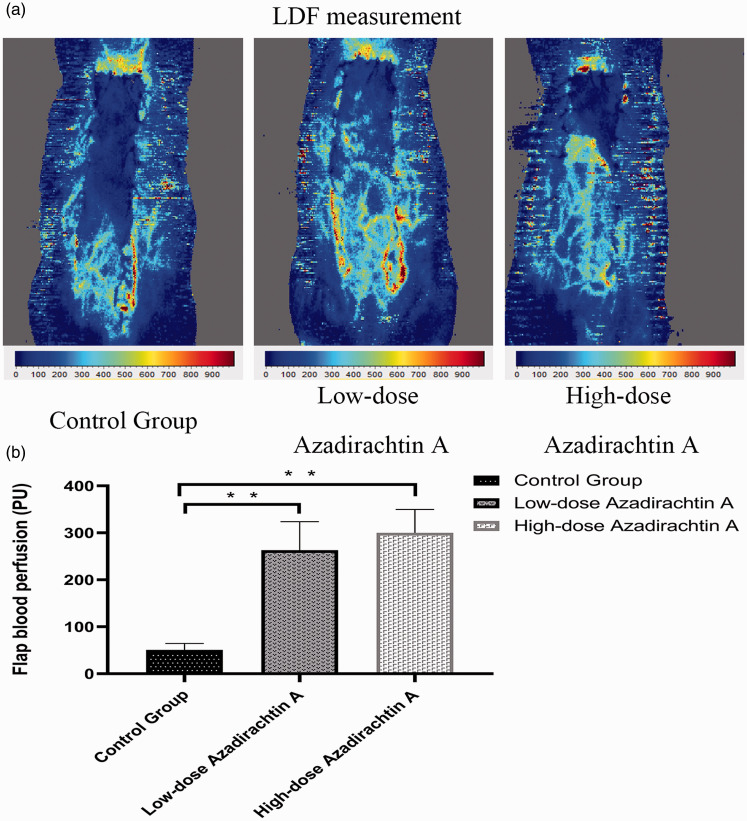
Figure 5.
AzaA increased blood flow. Laser Doppler flowmetry (LDF) angiography of flaps of the control and treatment groups (a). Mean blood perfusion levels of the Zones II of each group (b). **P < 0.01, low-dose and high-dose AzaA groups vs. control group; n = 6 per group. (A color version of this figure is available in the online journal.)

