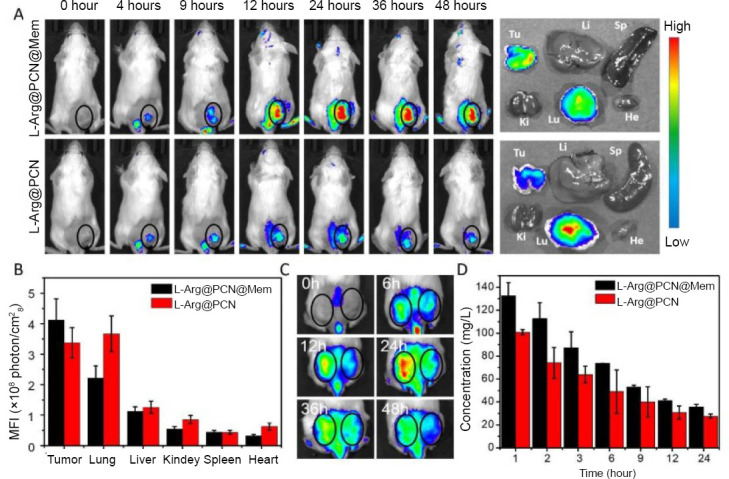
Figure 5.

In vivo targeted imaging and pharmacokinetics.
Note: (A) In vivo fluorescence imaging of 4T1 tumor-bearing mice at 0–48 hours after intravenous injection of L-Arg@PCN@Mem and L-Arg@PCN, and the fluorescence represents the materials. Right: The corresponding ex vivo tissues 48 hours post-injection. (B) The MFI value of the major organs and tumor tissues after 48 hours intravenous injection. (C) In vivo fluorescence imaging of 4T1 and CT26 dual tumor-bearing mouse at 0–48 hours after intravenous injection of L-Arg@PCN@Mem. Left ring: 4T1 tumor, right ring: CT26 tumor. (D) Blood concentrations of L-Arg@PCN@Mem and L-Arg@PCN after intravenous injection. He: Heart; Li: liver; Sp: spleen; Lu: lung; Ki: kidney; Tu: tumor; MFI: mean fluorescence intensity; L-Arg: L-arginine; PCN: porous coordination network; Mem: cancer cell membrane. Reprinted with permission from Wan et al.27
