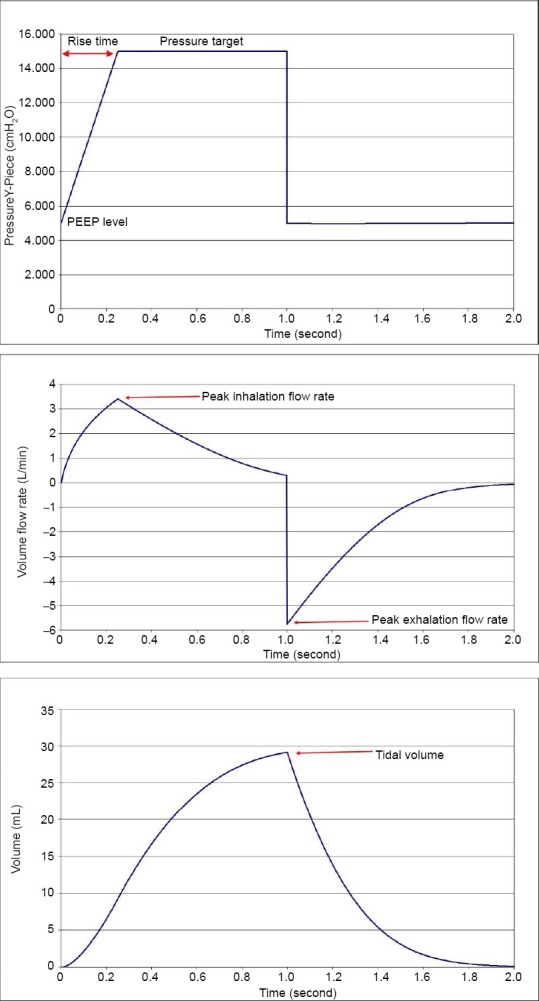
Figure 2.

Pressure control mode ventilation patterns for Y-Piece pressure (top), flow rate (middle) and volume (bottom) as would be seen on a ventilator control screen.
Note: Input and output variables used in the simulations also are defined on the graphs. The rise time was fixed at 0.25 second for all of the simulations. 1 cmH2O = 98 Pa.
