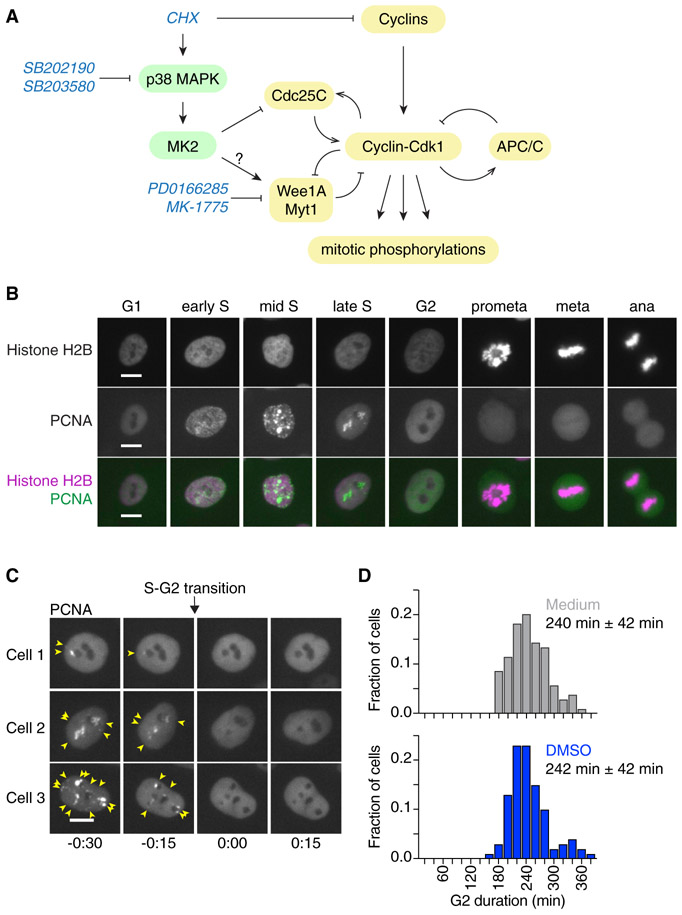
Figure 1. Measuring the Duration of Cell Cycle Phases Using Fluorescently Labeled PCNA and Histone H2B in MCF10A Cells.
(A) Schematic of the regulation of Cdk1 activity at the G2/M transition by cyclins and multiple feedback loops. The protein synthesis inhibitor cycloheximide (CHX) can block cyclin accumulation; it also activates p38 MAPK, which can delay G2/M progression by inhibiting Cdc25 and/or potentially activating Wee1/Myt1 (Reinhardt and Yaffe, 2009). The small-molecule inhibitors SB202190 and SB203580 and PD0166285 and MK-1775 have been used in this study to inhibit p38 MAPK or Wee1/Myt1 activity, respectively.
(B) eYFP-PCNA can be used to determine the onset of S phase, the completion of S phase, and the onset of mitosis (nuclear envelope breakdown); histone H2B-mTurquoise (used here) or histone H2B-mCherry can be used to determine anaphase onset. Scale bars: 10 μm.
(C) Three examples of cells showing the disappearance of eYFP-PCNA foci (yellow arrows) at the end of S phase. Times (in the format h:min) were aligned to the time of entry into G2 phase. Scale bars: 10 μm.
(D) Frequency distributions of G2 phase duration measured in MCF10A cells expressing H2B-mCherry and eYFP-PCNA either in the absence (“medium,” gray; n = 104) or presence of 0.1% DMSO (blue; n = 100). Means and standard deviations are indicated.

