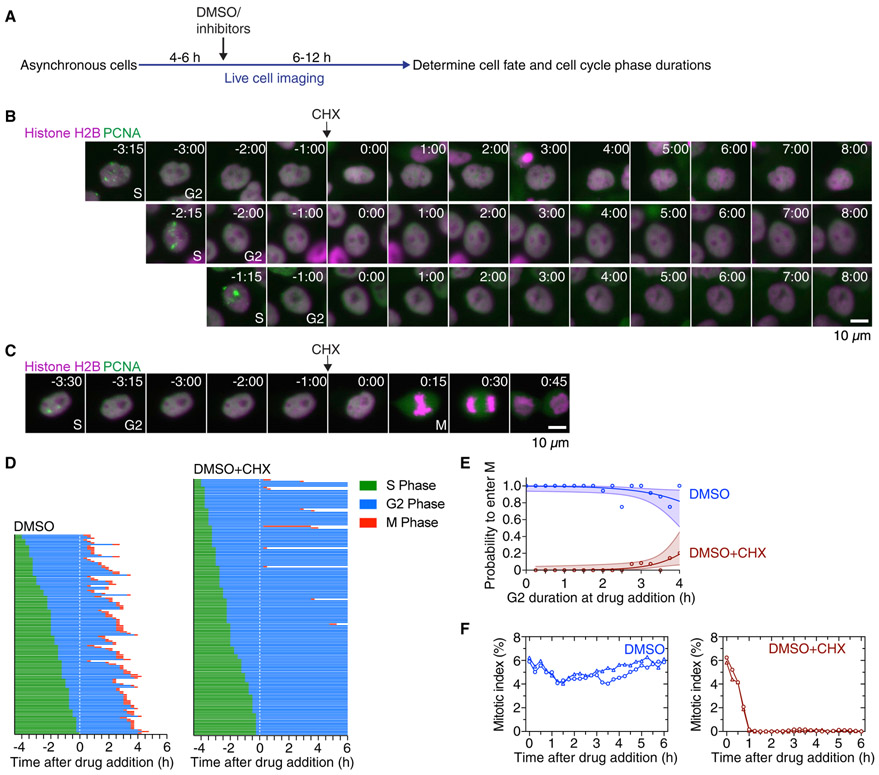
Figure 2. Cycloheximide Blocks Entry into Mitosis.
(A) Schematic of the experimental setup: asynchronously grown cells were imaged for 4–6 h in order to determine the time when cells exited S phase. After this period, DMSO or small-molecule inhibitors were added, and cells were followed for another 6–12 h to determine whether and when cells entered and progressed through mitosis.
(B and C) Montages of MCF10A cells expressing H2B-mCherry and eYFP-PCNA followed over the time course of the experiment described in (A). Times (in the format h:min) were aligned to the point of DMSO or cycloheximide addition. Four cells are shown that had spent different amounts of time in G2 phase at the time of cycloheximide addition and subsequently either arrested in G2 phase (B) or entered mitosis (C).
(D) Cell cycle progression in MCF10A cells expressing H2B-Turquoise and eYFP-PCNA and treated with DMSO (left; n = 130) or CHX (right; n = 165). Each row represents timing data from a single cell. The majority of cells treated with cycloheximide arrested in G2 phase.
(E) Logistic regression analysis. This estimates the probability of a cell entering mitosis as a function of how much time the cell had spent in G2 phase at the time of drug addition, for the experiment shown in (D). Circles indicate the fraction of cells that entered mitosis by 5.5 h after entry into G2 phase; this cutoff was the time at which 95% of the DMSO-treated control cells had entered mitosis. The solid lines show the logistic fit for the data, and the lightly colored areas indicate the 95% confidence intervals.
(F) Mitotic indices for MCF10A cells expressing H2B-Turquoise and eYFP-PCNA cells treated with DMSO or CHX. Shown are two independent experiments (circles and triangles, respectively). At least 3,605 cells were counted for each time point.

