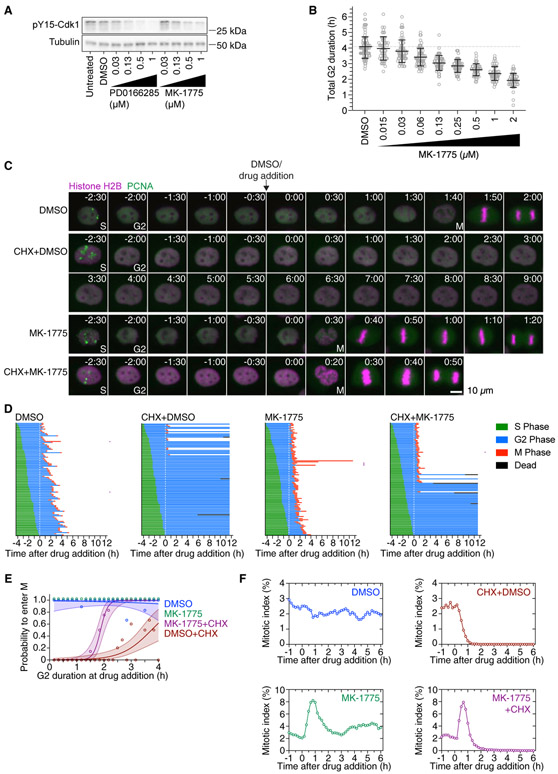
Figure 3. Wee1 Inhibition by MK-1775 Shortens G2 Phase and Restores Mitotic Entry in a Fraction of Cycloheximide-Treated G2 Phase Cells.
(A) Asynchronously growing MCF10A cells were treated with DMSO, different concentrations of the Wee1 inhibitor MK-1775 or the Wee1/Myt1-inhibitor PD0166285 for 1 h. The phosphorylation state of tyrosine 15 of Cdk1 as a measure of Wee1/Myt1 activity was analyzed by immunoblotting. α-tubulin was used as loading control. Uncropped immunoblots are shown in Figure S6A.
(B) G2 duration as a function of MK-1775 concentration. The duration of G2 phase of cells expressing H2B-mCherry and eYFP-PCNA was measured by live-cell fluorescence microscopy in the presence of DMSO or different concentrations of MK-1775. Only cells that had not entered G2 phase at the time of treatment and showed a distinct G2 phase were included in this analysis (n > 52 cells for all conditions).
(C) Montages of MCF10A cells expressing H2B-mCherry and eYFP-PCNA followed over the time course of the experiment described in Figure 2A. Times (in the format h:min) were aligned to the point of DMSO/drug addition (10 μg/mL CHX and/or 1 μM MK-1775).
(D) Cell cycle progression for MCF10A cells expressing H2B-mCherry and eYFP-PCNA and treated with DMSO (n = 100), cycloheximide (n = 103), MK-1775 (n = 105), or cycloheximide plus MK-1775 (n = 105). Each row represents timing data from a single cell. The majority of cells treated with cycloheximide arrested in G2 phase, whereas more of the cells treated with 1 μM MK-1775 in addition to cycloheximide entered mitosis. Rows marked with a purple square denote cells that underwent abnormal mitoses, often lacking proper metaphase and cytokinesis. A biological replicate is shown in Figure S1A.
(E) Logistic regression analysis. Probability of a cell entering mitosis as a function of how long the cell had been in G2 phase at the time of drug addition for the experiment shown in (D). Circles indicate the fraction of cells that entered mitosis by 5.3 h after entry into G2 phase; this cutoff was the time at which 95% of the DMSO-treated control cells had entered mitosis. The solid lines show the logistic fits for the data, and the lightly colored areas indicate the 95% confidence intervals. Note that the green (MK-1775) data points corresponding to a probability of 1.0 have been shifted upward to make them more visible.
(F) Mitotic indices for MCF10A cells expressing H2B-mCherry and eYFP-PCNA treated with DMSO, CHX, 1 μM MK-1775, or CHX plus 1 μM MK-1775. At least 4,547 cells were counted for each time point.

