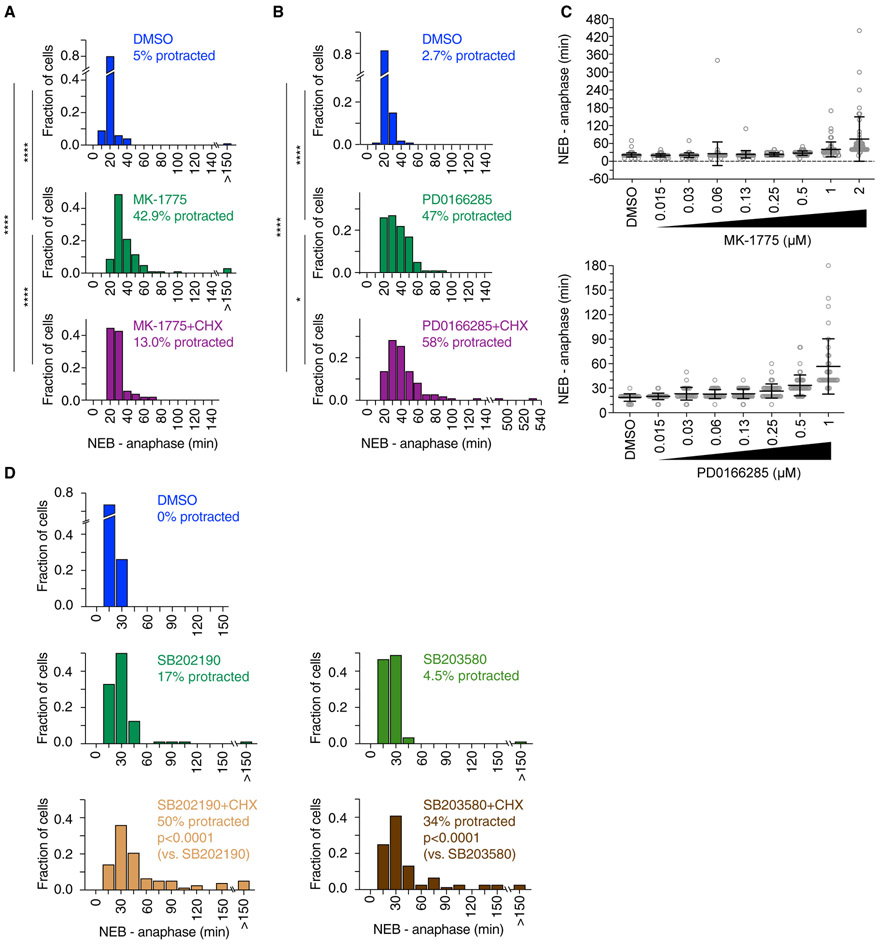
Figure 7. Protein Synthesis during G2 Phase Is Required for Normal Mitotic Progression.
(A) Frequency distribution of mitotic durations (measured from NEB to anaphase onset) of cells treated with DMSO (n = 100), 1 μM MK-1775 (n = 105), or CHX plus 1 μM MK-1775 (n = 54) during G2 phase. Cells were considered to exhibit a protracted mitosis if the mitotic duration exceeded the 95th percentile of the mitotic duration of DMSO-treated cells (>39.5 min). p values were calculated using a nonparametric Mann-Whitney test (****p < 0.0001).
(B) Frequency distribution of mitotic durations (measured from NEB to anaphase onset) of cells treated with DMSO (n = 113), 1 μM PD0166285 (n = 100), or CHX plus 1 μM PD0166285 (n = 110) during G2 phase. Cells were considered to exhibit a protracted mitosis if the mitotic duration exceeded the 95th percentile of the mitotic duration of DMSO-treated cells (>30 min). p values were calculated using a nonparametric Mann-Whitney test (*p < 0.05 and ****p < 0.0001).
(C) Mitotic duration was measured for cells that progressed through G2 phase and entered mitosis in the presence of DMSO or different concentrations of MK-1775 or PD0166285. Mitotic duration increased with higher concentrations of MK-1775 or PD0166285 (and shorter G2 duration; see Figures 3B and 4A).
(D) Frequency distribution of mitotic durations of cells treated with DMSO (n = 99), SB202190 (n = 88), SB203580 (n = 88), CHX+SB202190 (n = 76), or CHX+SB203580 (n = 77) during G2 phase. Cells were considered to exhibit a protracted mitosis if the mitotic duration exceeded the 95th percentile of the mitotic duration of DMSO-treated cells (>30 min). p values were calculated using a nonparametric Mann-Whitney test.

