
Figure 2.
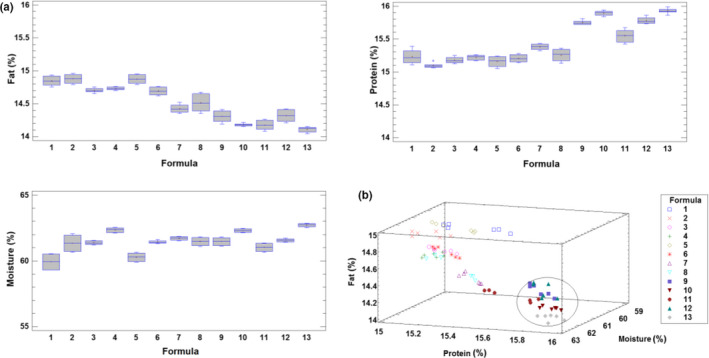
a) Box–whisker plots for the moisture, protein, and fat according to the different sausage formulations. b) 3D plot of moisture versus protein versus fat for the sausage samples according to the assayed formula
Official websites use .gov
A
.gov website belongs to an official
government organization in the United States.
Secure .gov websites use HTTPS
A lock (
) or https:// means you've safely
connected to the .gov website. Share sensitive
information only on official, secure websites.
a) Box–whisker plots for the moisture, protein, and fat according to the different sausage formulations. b) 3D plot of moisture versus protein versus fat for the sausage samples according to the assayed formula