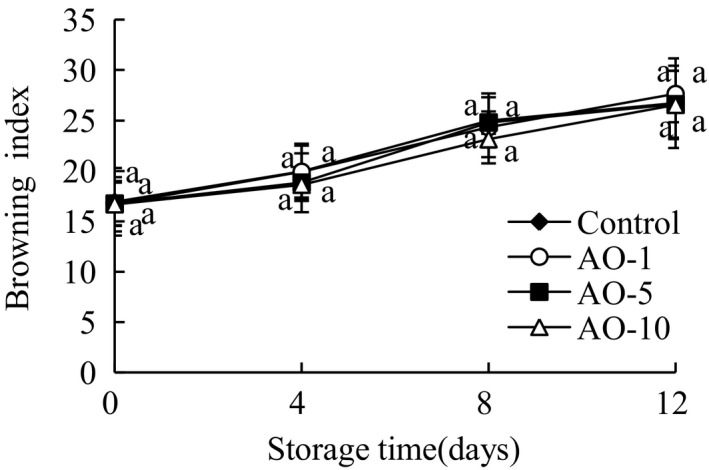
FIGURE 6.

Effects of aqueous ozone treatment on browning index of fresh‐cut cabbages during 12 days of storage (◆, Control; ○, AO‐1; ■, AO‐5; △, AO‐10). Data shown are the means (n = 3) ± standard deviation. For each treatment, different lower letters show significantly different (p < .05) in the same storage days
