FIGURE 1.

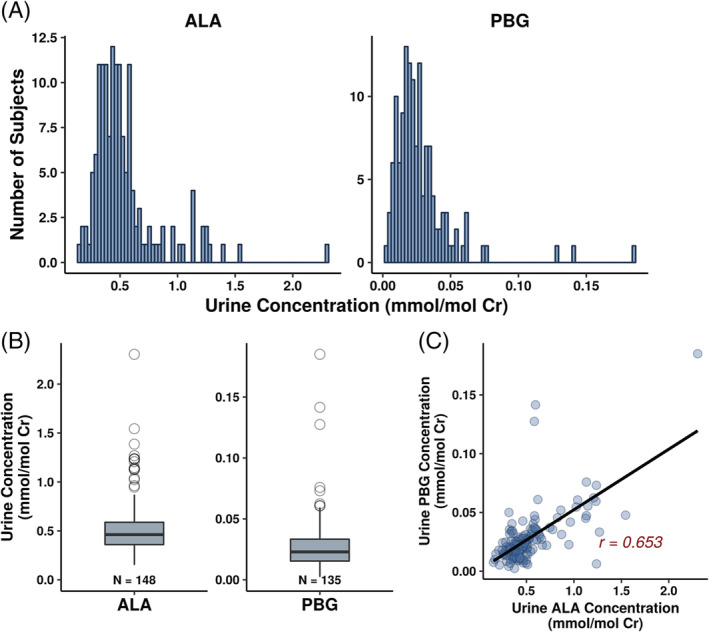
Distribution of urine ALA and PBG concentrations in healthy subjects (A, B), and correlation between urine ALA and PBG concentrations (C). ALA, aminolevulinic acid; Cr, creatinine; PBG, porphobilinogen

Distribution of urine ALA and PBG concentrations in healthy subjects (A, B), and correlation between urine ALA and PBG concentrations (C). ALA, aminolevulinic acid; Cr, creatinine; PBG, porphobilinogen