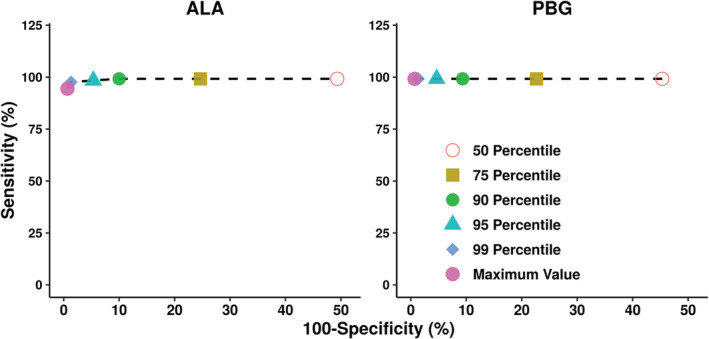
FIGURE 3.

Receiver operating characteristic (ROC) curves for ALA and PBG. ROC curves were constructed to evaluate the ability of different ULN thresholds (median, 75th, 90th, 95th, and 99th percentile, and maximum value) in differentiating ALA and PBG levels in healthy subjects from AIP patients. Baseline ALA and PBG levels from AIP patients in the phase 1 and EXPLORE studies were used. AIP, acute intermittent porphyria; ALA, aminolevulinic acid; PBG, porphobilinogen; ULN, upper limit of normal
