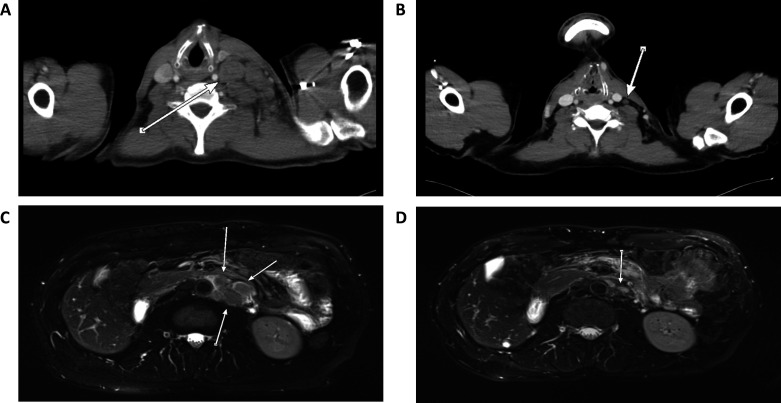
Figure 1.
CT/MRI scans at different time points over the course of the disease. (A) CT scan from March 2016 before start of initial treatment with pembrolizumab showing strong lymph node metastases (arrow). (B) CT scan from April 2018 under initial therapy with pembrolizumab showing shrinkage of the metastases (arrow) indicating great treatment response supported by mutated molecules per mL plasma (MM/mL) constantly at zero. (C) MRI scan from November 2019, 6 months after discontinuation of treatment with personalized neoepitope-derived multipeptide vaccines showing reappearance of enlarged paraaortal lymph nodes (arrows) corresponding with increasing MM/mL between 44.49 and 188.01. (D) MRI scan from February 2020, 3 months after re-initiation of treatment with pembrolizumab showing shrinkage of the enlarged lymph nodes (arrow) indicating a new treatment response corresponding with MM/mL returning to zero.

