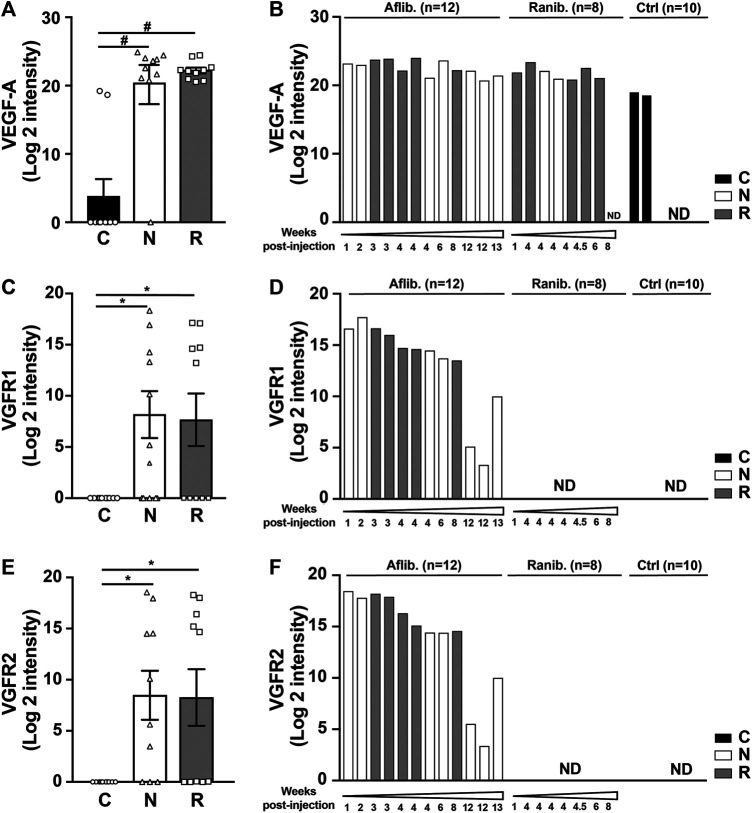
FIGURE 1.
Proteomic analyses of ten AH from each group of patient nAMD (N), rAMD (R), and controls (C). Graphic representation of VEGF-A (A), VEGFR1 (C) and VEGFR2 (E) levels obtained in the three different study groups. *p < 0.03 and #p < 0.0001 (Left). Graphs on the right represent the quantification of VEGF-A (B), VEGFR1 (D) and VEGFR2 (F) independently of the type of AMD but depending on the anti-VEGF treatment (aflibercept [Aflib] or ranibizumab [Ranib]) and classify according to the time after the last injection of anti-VEGF inhibitors.

