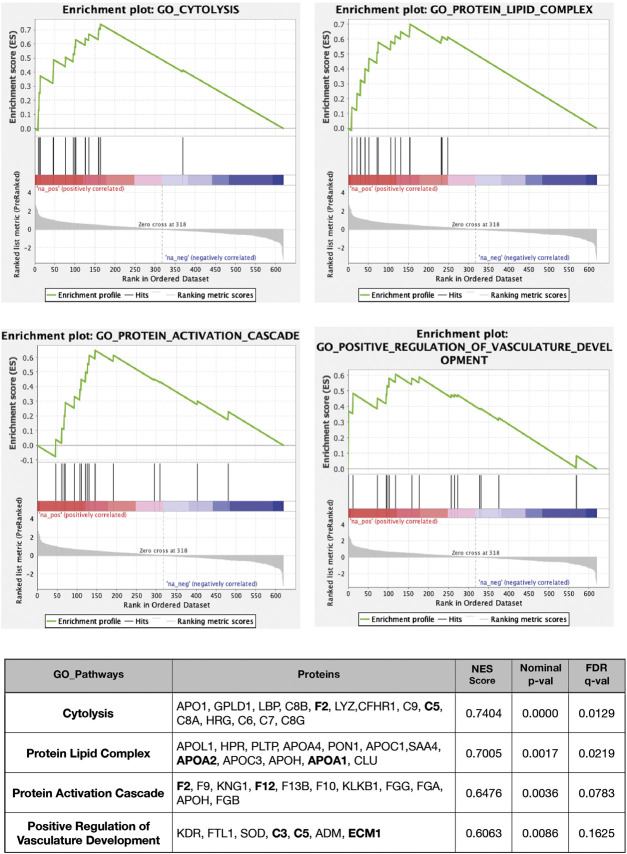
FIGURE 3.
GSEA-based GO analysis enrichment plots of representative gene sets for several pathways. The primary result of the gene set enrichment analysis is the enrichment score (ES, at the top of the green curve), which reflects the degree to which a gene set is overrepresented at the top or bottom of a ranked list of genes. GSEA calculates the ES by walking down the ranked list of genes, increasing a running-sum statistic when a gene is in the gene set and decreasing it when it is not. The magnitude of the increment depends on the correlation of the gene with the phenotype. The ES is the maximum deviation from zero encountered in walking the list. A positive ES indicates gene set enrichment at the top of the ranked list; a negative ES indicates gene set enrichment at the bottom of the ranked list. The middle portion of the plot shows where the members of the gene set appear in the ranked list of genes. The bottom part of the plot shows the values of the estimates of the linear model. Genes included in GO pathways, normalized enrichment scores, nominal p-values (from 1,000 permutations), and FDR q-values are indicated in the table. The complete lists of the GSEA output are provided for positive and negative enrichment. For more details, see the supplemental Excel table.

