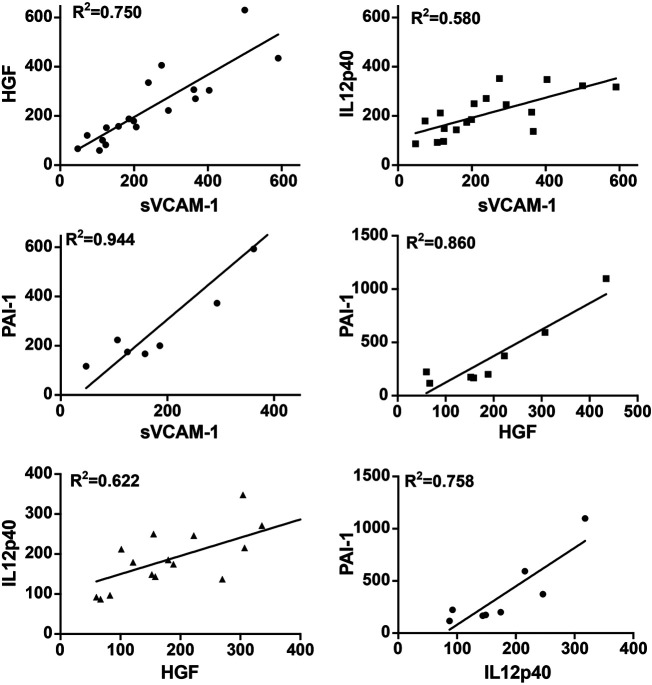
FIGURE 6.
Correlation between different AH biomarkers in group R with incomplete anti-VEGF response. Levels of 4 biomarkers were compared in AH of incomplete responders. A linear regression (R 2) was measured in all comparisons. sVCAM-1 vs. PAI-1: R 2 = 0.944; sVCAM-1 vs. HGF: R 2 = 0.750; sVCAM-1 vs. IL-12p40: R 2 = 0.508; HGF vs. PAI-1: R 2 = 0.806; HGF vs. IL-12p40: R 2 = 0.622; IL-12p40 vs. PAI-1: R 2 = 0.758.

