Figure 1.
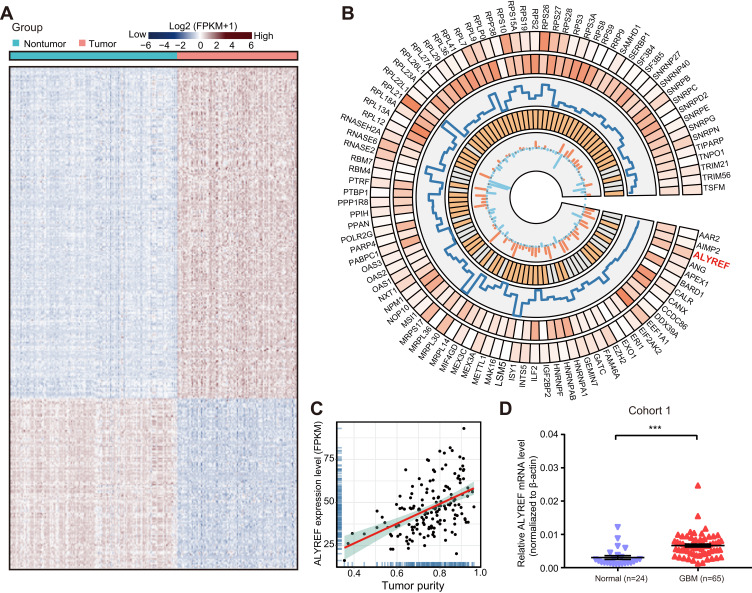
The dysregulated RBPs in GBM tissues. (A) Clustered heatmap of 1542 RBPs in TCGA-GBM and GTEx cohort. (B) The circular panel represented the top up-regulated 91 RBP genes. This circos plot was constructed by five tracks: (1) The expression level in normal brain tissue; (2) The expression level in GBM tissue; (3) Fold change (tumor/normal tissue); (4) Hazard ratio value; (5) The correlation between proliferative ability and mRNA levels of RBPs. (C) The correlation coefficient of ALYREF mRNA levels with tumor purity in TCGA-GBM cohort. (D) The relative mRNA levels of ALYREF in GBM and normal tissues. The results are shown as the mean ± SEM in (D). ***P < 0.001.

