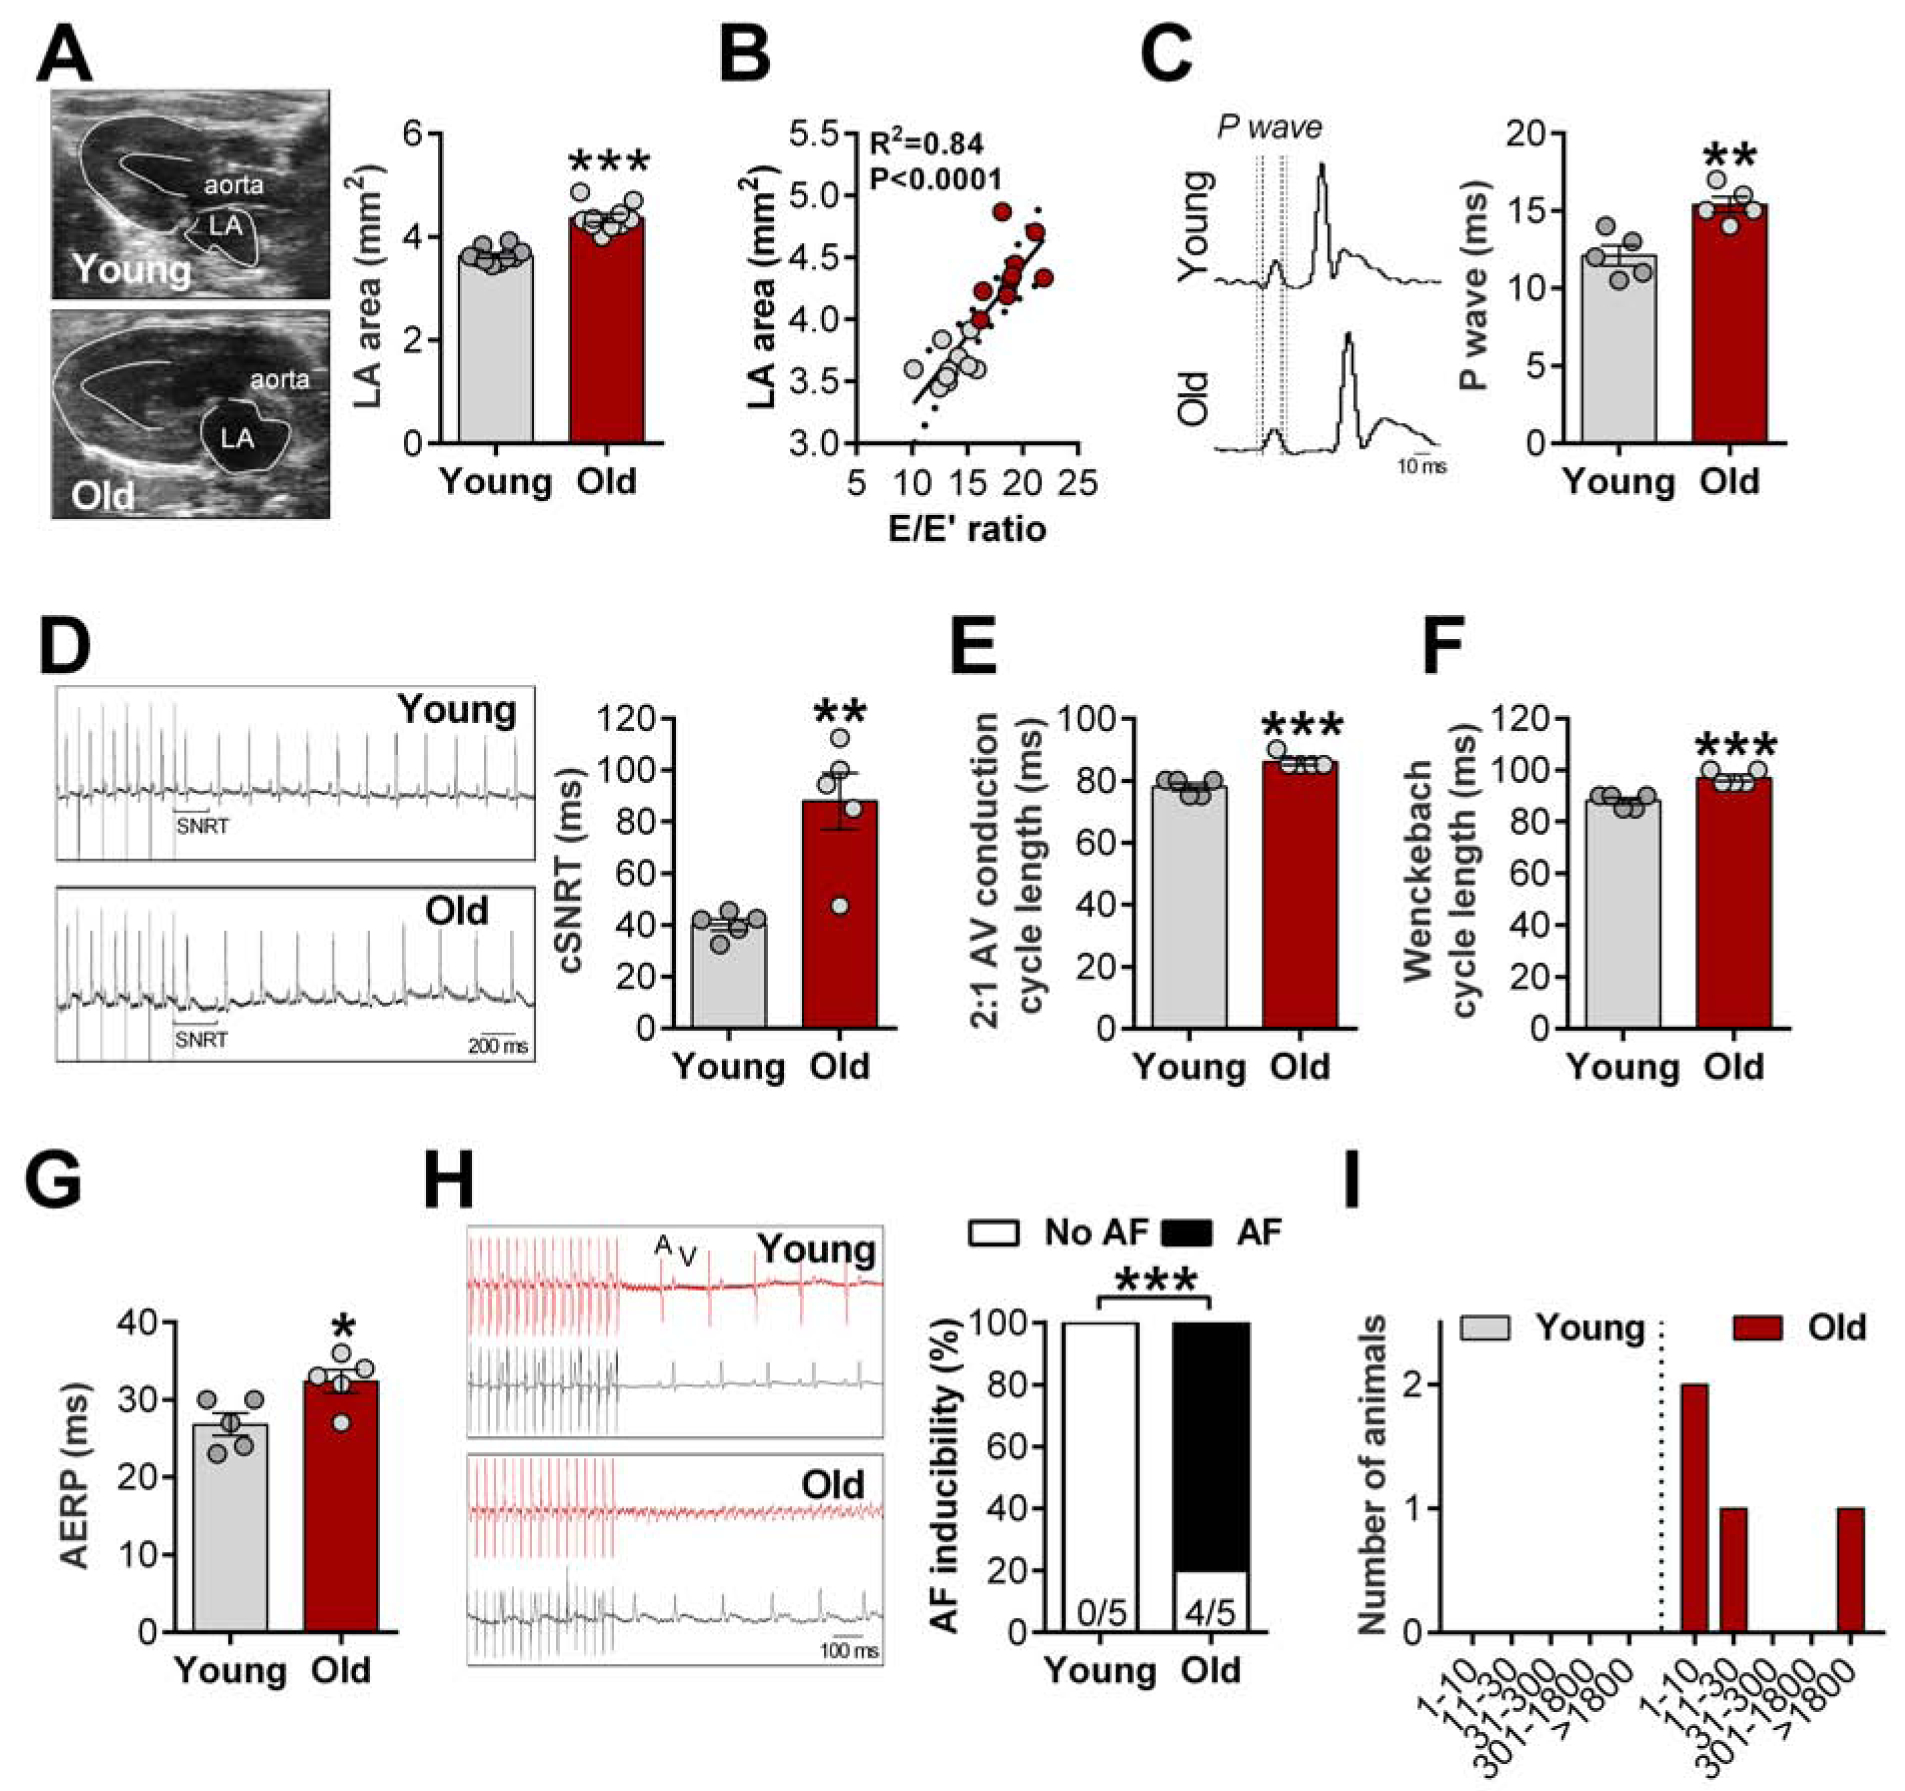
Figure 2. Atrial enlargement and SAN/AV dysfunction underlie high atrial fibrillation incidence in aged rats.

A, Representative B-mode echocardiography recordings (left) and quantification of left atrial (LA) area (right); B, Relationship between E/E’ ratio and LA area, data fit by linear regression; 95% confidence limits. C, Representative ECG recordings (left), dashed lines highlight prolonged P wave duration in aged animals and quantification of P wave duration (right); D, Representative ECG recordings (left) and quantification of corrected sinoatrial node recovery time (cSNRT, right); E-F, 2:1 AV conduction cycle length (E) and Wenckebach cycle length (F) assess AV node function; G, Quantification of atrial effective refractory period (AERP); H, Representative simultaneous recordings of intracardiac potentials (red line) and surface ECG (lead II, black line) protocol used to induce atrial fibrillation (AF, left) and incidence of pacing-induced AF (right); I, Duration of AF in young and aged animals. Data are expressed as mean ± SEM. Unpaired Student’s t-test. χ2-test without Yates correction (H). *P<0.05, **P<0.01, ***P<0.001 vs. young females.
