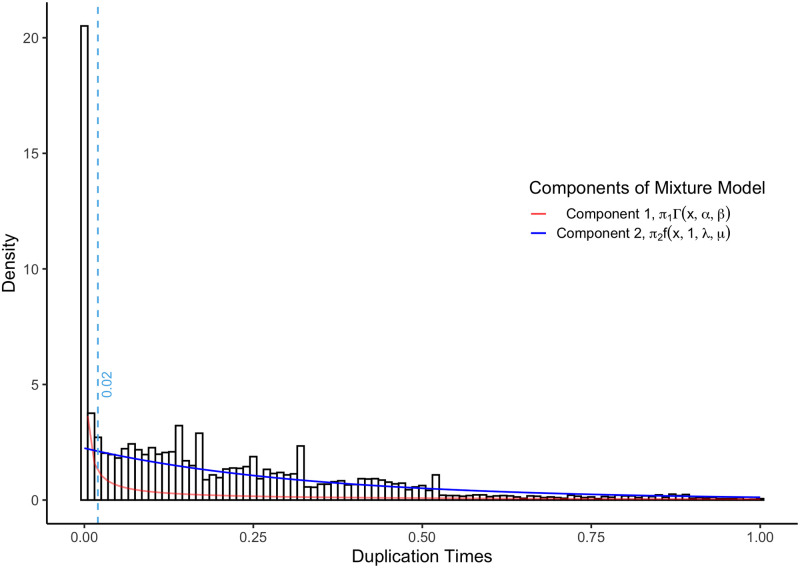
Fig 5. Histogram of the inferred duplication times with an overlaid mixture model.
Component 1 of the mixture model (red) captures the technical issues we address here, where transcripts from the same gene are assigned to different genes, and component 2 (blue) captures the true biological pattern, where transcripts from different genes are correctly assigned to different genes. We first ran phyldog [16] on the test dataset using the multiple sequence alignments and a given species phylogeny [20]. This provided gene phylogenies with internal nodes annotated as duplication or speciation events. We then used the annotations to time-calibrate the gene phylogenies for the mixture model.

