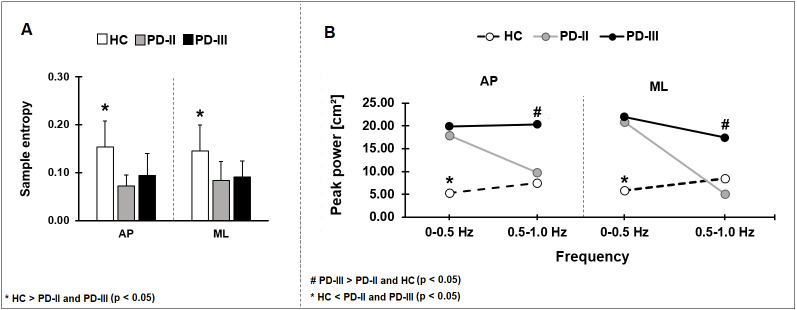
Fig 3. We compared sample entropy (A) and peak power (B) among HC, PD-II and PD-III.
Sample entropy was significantly lower in mild and moderate PD participants relative to HC. The peak power was greater at 0–0.5 Hz frequencies bands in both the PD-II and PD-III groups relative to HC and at 0.5–1.0 Hz was greater in PD-III relative to PD-II and HC. AP–anterior-posterior direction, ML–medio-lateral direction.

