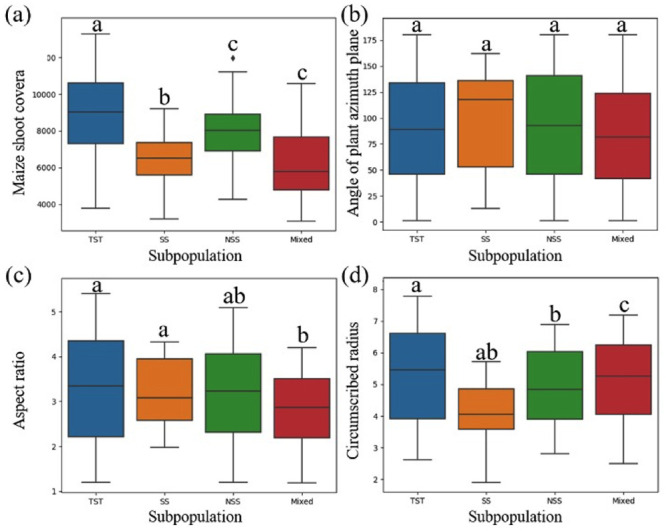
Fig 8. Various phenotypic parameters were analyzed based on the differences of different subpopulations, in which the absence of shared letters indicated that the numerical differences of phenotypic parameters among subgroups were statistically significant (P<0.05).

(a) Coverage, (b) the angle of plant azimuth plane, (c) aspect ratio, (d) circumscribed radius.
