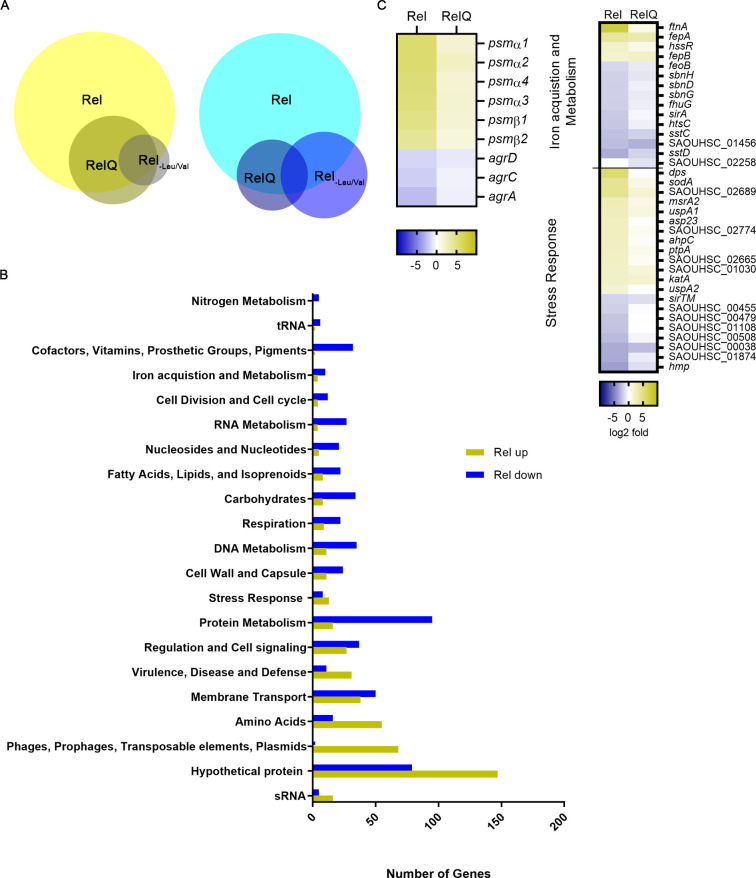
Fig 2. Global changes in gene expression upon transcriptional induction of rel-Syn or relQ.
(pp)pGpp0 with inducible rel-Syn or relQ was grown to OD600 = 0.3 and treated for 30 min without or with 0.1 μg/ml ATc. A. Venn diagrams showing genes or sRNAs upregulated (yellow) or downregulated (blue) after induction in comparison to uninduced cultures (< 3-fold difference, p< 0.001). Previously, described stringent genes [22] are indicated as Rel-Leu/Val. B. Genes with significant changes after induction of rel-syn (< 3-fold difference, p< 0.001) according to functional categories. C. Heatmap representing Rel-Syn-dependent up- and downregulated genes assigned to the functional categories iron acquisition and metabolism, stress response and Agr-related genes.

