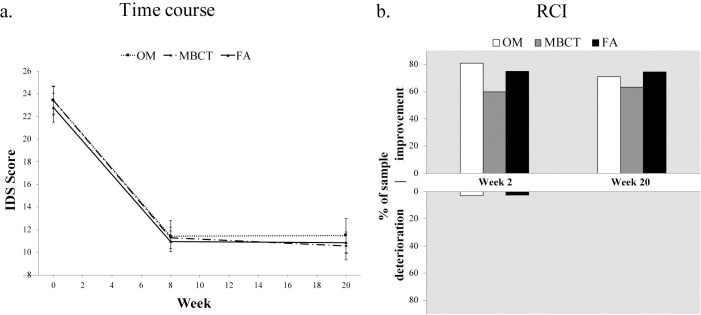
Fig 2. Differential treatment effects and clinically significant change in depression (IDS) for all three treatments over time.
(a) Group means (symbol) and standard error (error bars) at baseline (week 0), post-treatment (week 8) and follow-up (week 20) in intent-to-treat regression analysis (n = 104). (b) Reliable change index (RCI) at each timepoint relative to baseline scores. Upward and downward bars signify % of each treatment sample showing clinically significant improvements and deteriorations, respectively. Percent of sample with no reliable change is not shown (see S1 Appendix).

