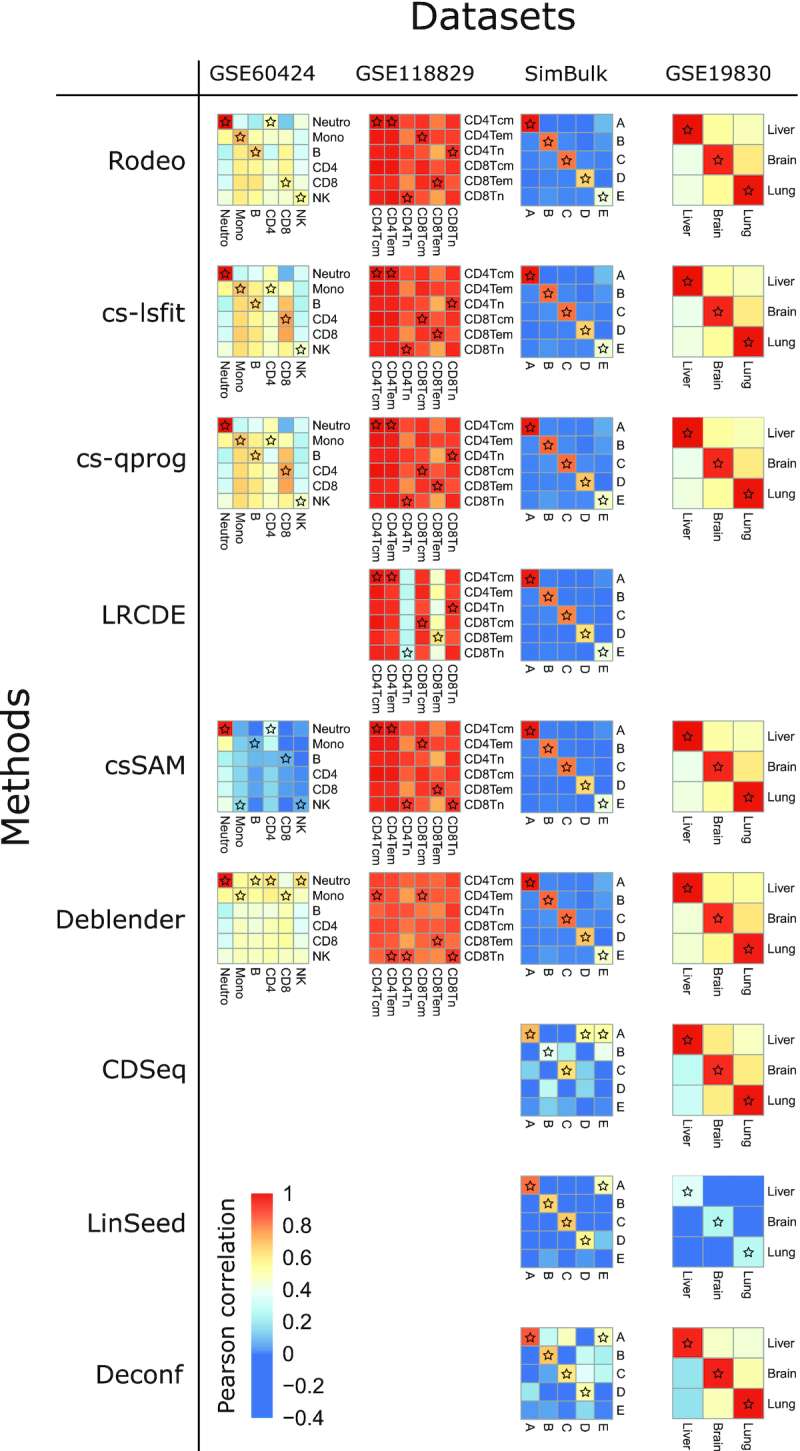
Figure 1.

Correlations between estimated and known cell type-specific expression profiles. In each heatmap, rows and columns correspond to known and estimated csGEPs, respectively. For an ideal method, the diagonal would have higher correlations than the rest of the heatmap. The known csGEP (row) with the highest correlation with each estimated csGEP (column) is marked with a star.
