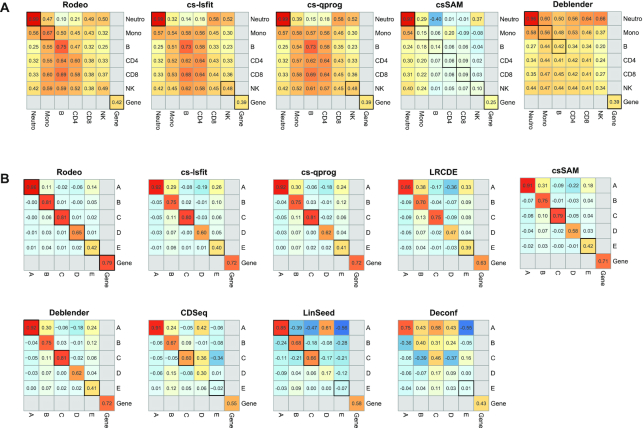
Figure 3.
The accuracy of estimated S when the input data contains few outlier samples. The correlation between known and estimated csGEPs and gene profiles (median gene correlation reported here) are visualized for (A) GSE60424 and (B) SimBulk including outlier samples. If a correlation between known and estimated csGEP of the same cell type or gene profile (i.e. diagonal of a heatmap) changed <0.05 as compared to the correlation obtained without outliers, the correlation is emphasized with a black frame.

