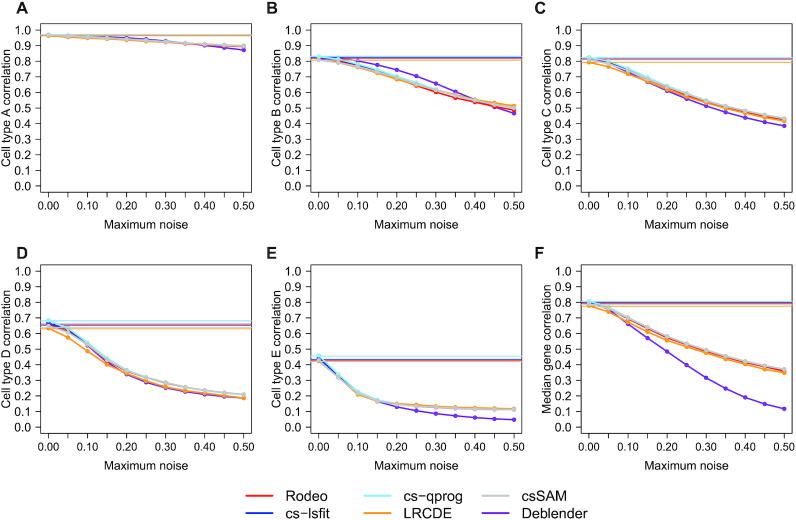
Figure 5.
Effect of noise in the cell type proportion matrix C on the correlation between known and estimated csGEPs (subfigures A–E) and on the median gene correlation (subfigure F) in dataset SimBulk. Pearson correlation (y-axis) is shown at different noise levels (x-axis) added to the estimated cell type proportions C. The horizontal lines illustrate the accuracies obtained with known C.

