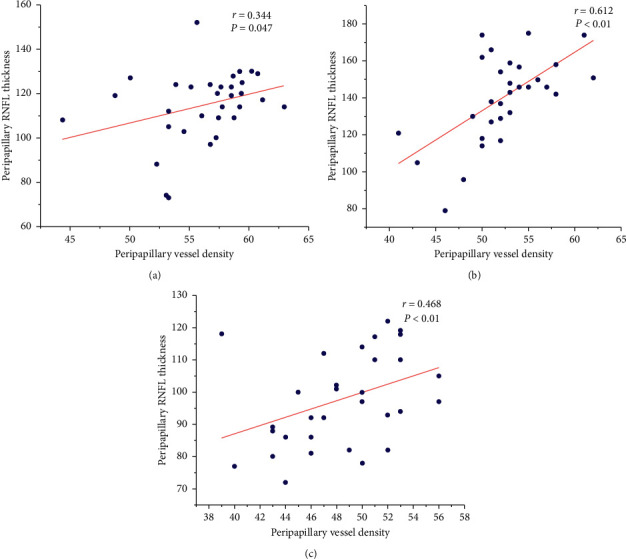
Figure 3.

Scatter plots of RNFL thickness and peripapillary vessel density in the preclinical group. (a) Scatter plot of average RNFL thickness and vessel density. (b) Scatter plot of superior RNFL thickness and vessel density. (c) Scatter plot of temporal RNFL thickness and vessel density.
