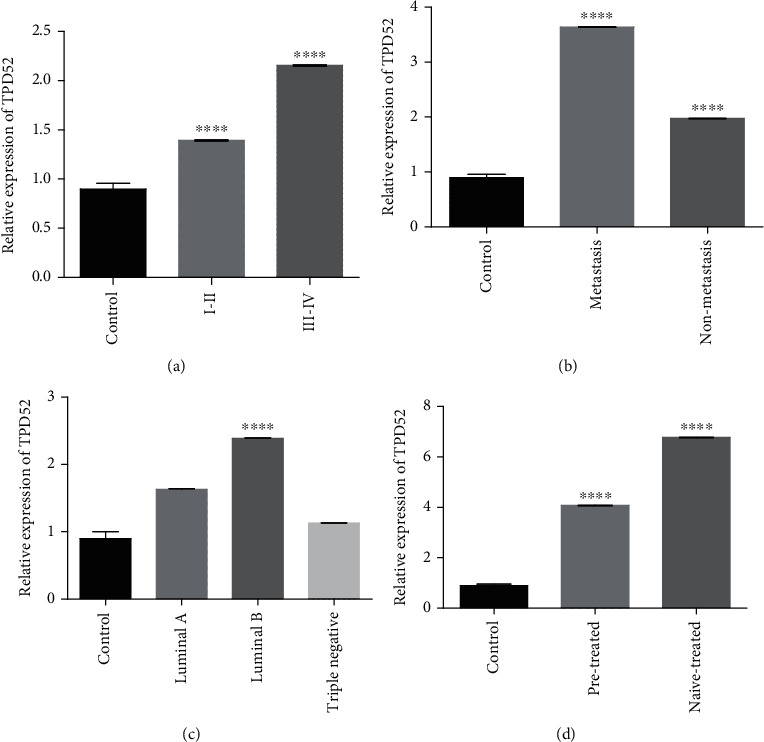
Figure 9.

qPCR analysis of TPD52 expression in clinical characteristics of breast cancer cases. Correlation of TPD52 expression with (a) tumor stage, (b) metastasis, (c) receptor status, and (d) treatment condition. There was upregulated expression of TPD52 in lower tumor stages (I and II), nonmetastasis, cancer subtype (luminal B), and naïve-treated groups. The data expressed as fold change represents the mean ± standard error experiments performed in triplicate. Ordinary one-way ANOVA was used to establish significance (∗∗∗∗p < 0.0001).
