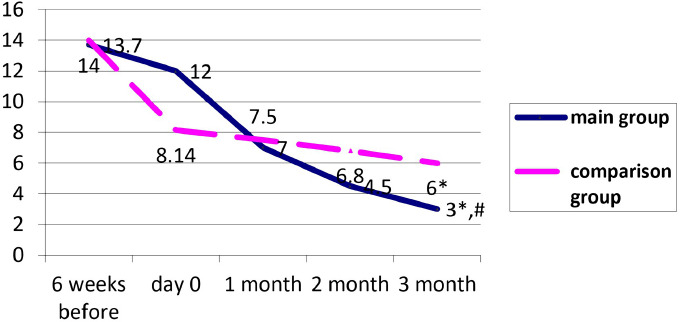
Figure 2:

Dynamics of median CRP levels in the main and comparison group receiving the therapy.
* - a significant difference in the CRP levels in the main and comparison group on day 0 and after 3 months; # - a significant difference in CRP levels at 3 months between the main and comparison group.
