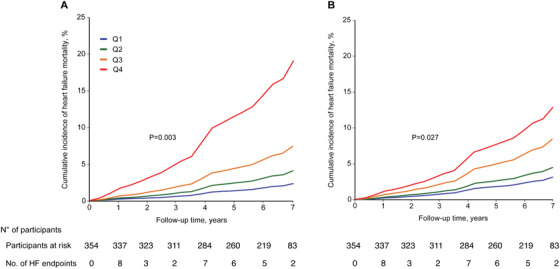
FIGURE 2.

Cumulative incidence of heart failure deaths stratified by the quartiles of (A) urinary classifier scores and (B) serum classifier scores. Among the 354 patients included, 33 heart failure deaths occurred. The cumulative incidence was adjusted for age, sex, body mass index, history of ischemic disease, heart rate, and serum creatinine. Q1 to Q4 represent the highest quartile to the lowest quartile of the classifier score. P‐values for trend were derived by Cox proportional hazards regression. The corresponding number of subjects at risk and the number of HF endpoints at yearly intervals are shown below the figure
