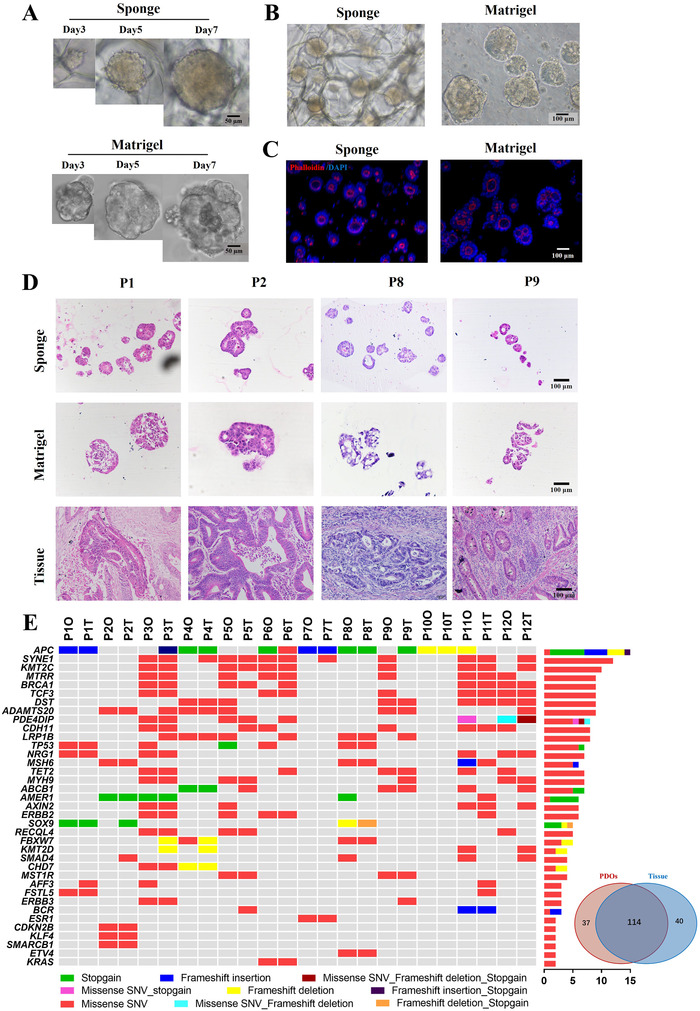
FIGURE 2.

Phenotype and genotype of mCRC patient‐derived organoids (mCRC‐PDOs) in HA‐Coll sponges. Freshed isolated tumor cells derived from mCRC patients were seeded into HA‐Coll sponges or Matrigel in 48‐well plates (5 × 10³/well). (A) Representative time course of the mCRC organoids from the same parental biopsy in HA‐Coll sponges (top) or Matrigel (bottom). (B) Representative phase‐contrast images of mCRC‐PDOs derived from the same parental biopsy in HA‐Coll sponges or Matrigel 14 days after implantation. (C) Representative 3D confocal fluorescence images of mCRC‐PDOs derived from the same parental biopsy in HA‐Coll sponges or Matrigel 14 days after implantation. Phalloidin for cytoskeleton(red). Counterstain is DAPI (blue). (D) PDOsSponge reconstitute the histology and morphology of parental tissue. H&E staining of PDOs from FO‐sensitive PR patients comparing to their parental tumors. (E) Molecular characterization of mCRC‐PDOs in HA‐Coll sponges. Heatmap showing the most frequently mutated genes in PDOsSponge and their parental tissues. Venn diagram demonstrating 74% mutational overlap between PDOsSponge and parental tissue biopsies
