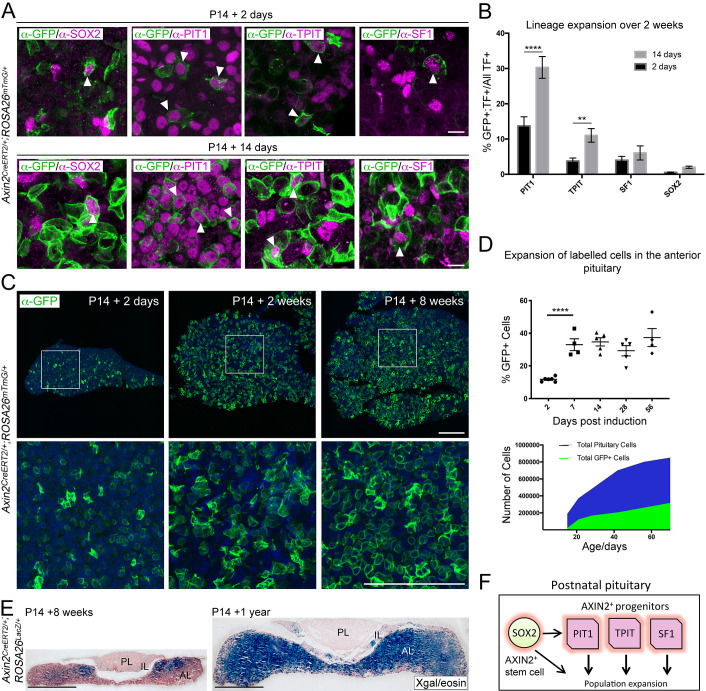
Figure 1. Axin2 expressing cells contribute to pituitary growth and expansion of all lineages.
(A) Immunofluorescence staining against GFP (green) with markers of pituitary stem cells (PSCs) or lineage commitment (magenta) in Axin2CreERT2/+; ROSA26mTmG/+ pituitaries harvested from mice induced at P14 and lineage traced for 2 days (top panel) and 14 days (bottom panel). Scale bar: 10 μm. (B) Quantification of lineage expansion between 2 and 14 days following induction at P14. Graph shows that the proportion of lineage committed cells (either PIT1+, TPIT+, or SF1+) and PSCs (SOX2+), that is, that are transcription factor (TF)+ cells that are GFP+ increases between 2 days (black bars) and 14 days (grey bars) post-induction. PIT1 p=0.000004, TPIT p=0.008 multiple t-tests. n = 4 animals per time point. (C) Immunofluorescence staining against GFP (green) in pituitaries harvested from Axin2CreERT2/+;ROSA26mTmG/+ mice induced at P14 and lineage traced for 2 days, 2 weeks, and 8 weeks. Bottom panel shows magnified fields of view of regions of interest indicated by white boxes in panels above. Scale bars: 50 μm. (D) Top panel showing the quantification of the proportion of all cells in Axin2CreERT2/+;ROSA26mTmG/+ pituitaries that are GFP+ at 2, 7, 14, 28, and 56 days post-induction as analysed by flow cytometry. Days 2–7 p<0.0001 unpaired t-test. Data points show individual measurements from biological replicates, n = 4–8 pituitaries per time point. (Bottom) Graph of the absolute number of GFP+ cells (green) and as a proportion of total cells (blue) at the time points indicated. (E) X-gal staining in Axin2CreERT2/+;ROSA26LacZ/+ pituitaries harvested from mice induced at P14 and lineage traced for 8 weeks (left) and 1 year (right). Scale bars: 500 μm. (F) Model summarising the major contribution of WNT-responsive progenitors of all lineages to pituitary growth, in addition to that of SOX2+ PSCs.


