Figure 2. Activation of WNT signalling in SOX2+ pituitary stem cells (PSCs) and their descendants is necessary for long-term growth.
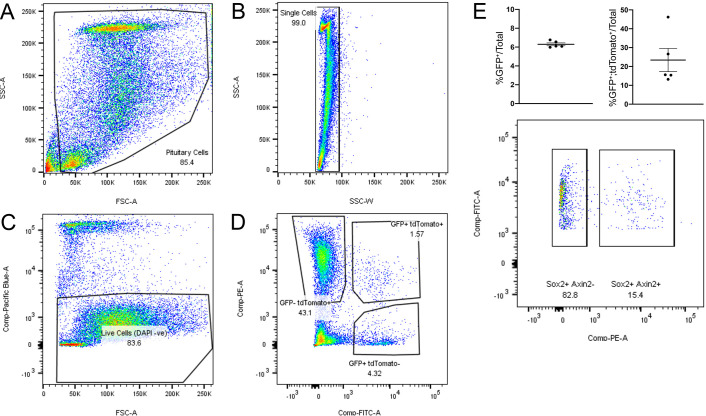
(A) Schematic of the experimental timeline used in panels A and B. Endogenous expression of tdTomato (magenta, Axin2 targeted cells) and EGFP (green, Sox2 expressing cells) in Axin2CreERT2/+;Sox2Egfp/+;ROSA26tdTomato/+ pituitaries harvested at P24 sectioned in the frontal plane. Nuclei are counterstained with Hoechst in the merged panel. Scale bar: 50 μm. (B) A representative culture plate showing colonies derived from Tomato+, EGFP+, or Tomato+;EGFP+ cells that were isolated from Axin2CreERT2/+;Sox2Egfp/+;ROSA26tdTomato/+ pituitaries by fluorescence-activated cell sorting (FACS) plated in stem cell promoting media at clonogenic densities and stained with crystal violet (left panel). The proportion of colony-forming cells in each subpopulation was quantified by counting the number of colonies per well (right panel). Each data point indicates individual wells, n = 5 separate pituitaries. p=0.0226, Mann–Whitney U-test (two-tailed). Scale bar: 10 mm. (C) Immunofluorescence staining against SOX2 (green) and Ki-67 (magenta) in Sox2+/+Ctnnb1LOF/LOF (control) and Sox2CreERT2/+Ctnnb1LOF/LOF (mutant) pituitaries from mice induced at P14 and analysed 22 weeks after induction (at P168) (bottom panel). Scale bar: 50 μm. (D) Dorsal view of whole mount pituitaries of Sox2+/+;Ctnnb1LOF/LOF (control) and Sox2CreERT2/+;Ctnnb1LOF/LOF (mutant), 22 weeks after induction (i.e. P168). Scale bars: 1 mm. (E) Model summarising the effect of Ctnnb1 deletion in SOX2+ PSCs. PL, posterior lobe; IL, intermediate lobe; AL, anterior lobe.


