. 2021 Jan 5;10:e59142. doi: 10.7554/eLife.59142

Figure 3. SOX2pituitary stem cells (PSCs) are as a source of WNT ligands in the pituitary.

(A) Immunofluorescence staining against GFP (green) and SOX2 (magenta) in Axin2CreERT2/+; ROSA26mTmG/+ pituitaries 48 hr post-induction. Graph representing a quantification of the proximity of individual GFP+ cells to the nearest SOX2+ cell as quantified by the number of nuclei separating them. Plotted data represents the proportion of GFP+ cells that fall into each category of the total GFP+ cells, taken from n = 3 separate pituitaries. Scale bars: 50 μm. (B) Experimental paradigm for RNA Seq analysis of Sox2 positive and negative cells. (C) Graphs representing the FPKM values of Wls and Porcupine in Sox2 positive and negative cells (black and grey bars, respectively). mRNA in situ hybridisation for Sox2 and for Wls on wild-type sagittal pituitaries at P14, demonstrating strong Wls expression in the marginal zone epithelium. Scale bars: 250 μm. (D) Bar chart showing the FPKM values of Wnt genes in the Sox2+ and Sox2 fractions. Double mRNA in situ hybridisation against Wnt2, Wnt5a, and Wnt9a (blue) together with Sox2 (red) validating expression in the Sox2+ population. Boxed regions through the marginal zone epithelium are magnified. Scale bars: 100 μm and 50 μm in boxed inserts.

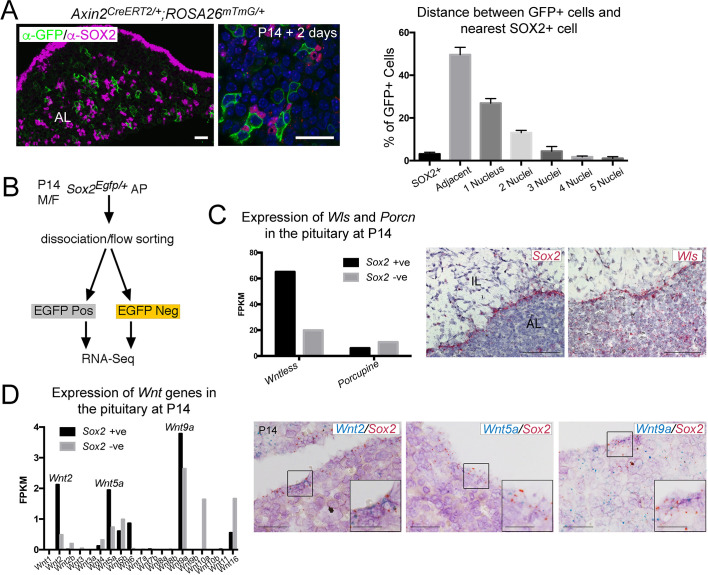
Figure 3.

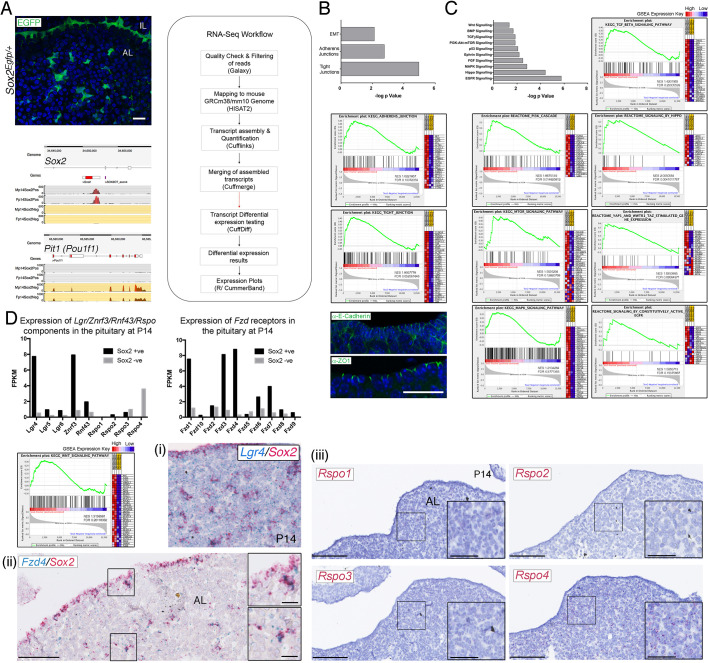
Figure 3—figure supplement 1. SOX2pituitary stem cells (PSCs) are as a source of WNT ligands in the pituitary.

Figure 3—figure supplement 1.

(A) Native EGFP protein expression in frontal cryosection of a P14 Sox2Egfp/+ pituitary. Schematic of the workflow used for bulk RNA-sequencing analysis of Sox2+ and Sox2 cells. Genome browser views of reads aligning to the Sox2 and Pit1 loci in the positive and negative fractions indicating good separation of the EGFP+ population. Scale bar: 50 µm. (B) Sox2+ cells express a significant enrichment in markers associated with epithelial-to-mesenchymal transition (EMT), adherens, and tight junctions, consistent with their epithelial nature. Gene set enrichment analysis (GSEA) plots and immunofluorescence staining against E-Cadherin (adherens junction marker) and ZO1 (tight junction marker) in the marginal zone epithelium at P14. Scale bar: 50 µm. See Supplementary file 1 for full GSEA gene lists. (C) Sox2+ cells express a significant enrichment in several signalling pathways, shown with respective GSEA plots. See Supplementary file 1 for full GSEA gene lists. (D) Bar charts showing the FPKM values of components of the LGR/RNF43/ZNRF3/R-spondin module in the Sox2+ and Sox2 fractions and the distribution of the Frizzled receptors. GSEA plot for components of the WNT pathway. Validation of sequencing: (i) mRNA in situ hybridisation with specific probes against Lgr4 (blue) and Sox2 (red) in P14 pituitaries showing co-expression. (ii) Double mRNA in situ hybridisation against Fzd4 (blue) and Sox2 (red) indicating co-expression in both the marginal zone epithelium and parenchymal Sox2+ cells. Boxed regions are magnified. Scale bars: 250 µm and 50 μm in boxed inserts. (iii) mRNA in situ hybridisation against Rspo1, Rspo2, Rspo3, and Rspo4 in sagittal sections of wild-type pituitaries at P14. Boxed regions are magnified, only Rspo4 is detected. Scale bars: 250 µm and 100 μm in boxed inserts.