Figure 2. Post-transplantation, pre-ATI CD4+ and CD8+ T cell dynamics.
(A) Empirical data for peripheral CD4+ CCR5+ (top row), CD4+CCR5- (middle row), and CD8+ T cell counts (bottom row) for control (blue), wild-type (red), and ΔCCR5 (green) transplantation groups. Each data point shape and color is a different animal sampled over time. (B) Distributions of blood CD4+ and CD8+ T cell counts for weeks 0, 10, and 25 after transplantation (p-values calculated with pairwise Mann-Whitney test with Bonferroni correction comparing control group with transplant groups. *p<0.05, **p<0.01 and ***p<0.001). (C) Expansion-rate estimates of CD4+CCR5+, CD4+CCR5-, and CD8+ T cells (p-values calculated with paired Mann-Whitney test with Bonferroni correction comparing expansion rates of CD4+CCR5- with CD4+CCR5+ and CD8+ in transplant groups. **p<0.01 for both). Colors for boxplots in B and C are matched to A (blue: control, red: wild-type-transplantation, and green: ΔCCR5-transplantation groups).

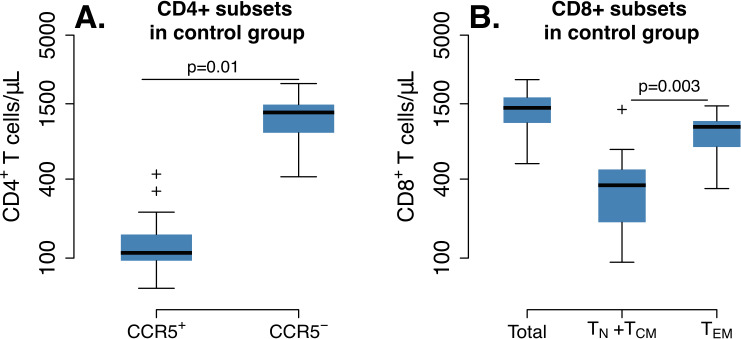
Figure 2—figure supplement 1. CD4+ and CD8+ T cell levels pre-ATI in control group (n = 5) at times relative to post-transplantation in WT and ΔCCR5 transplant groups.