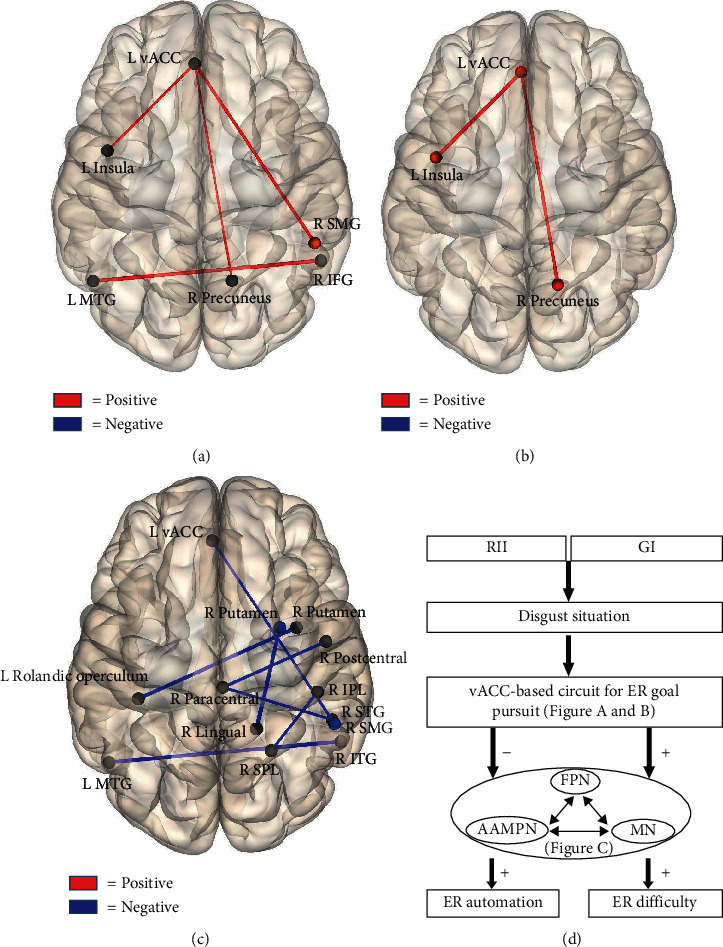
Figure 6.

Functional connectivity patterns of the contrasts GI (a) and RII (b) versus watching condition and the contrast RII versus GI (c). The connections (edges) between ROIs marked in red mean that GI or RII relative to watching shows greater FC strength, and those marked in blue mean that RII relative to GI shows weaker FC intensity. ITG: inferior temporal gyri; MTG: middle temporal gyri; SMG: supramarginal gyri; STG: superior temporal gyri; IPL: inferior parietal lobule; SPL: superior parietal lobule; SMG: supramarginal gyri. (d) The dynamic architecture of the FC mechanisms underlying GI and RII. FPN: frontoparietal network; AAMPN: aversive anticipation and motor planning network; MN: memory network; ER: emotion regulation.
